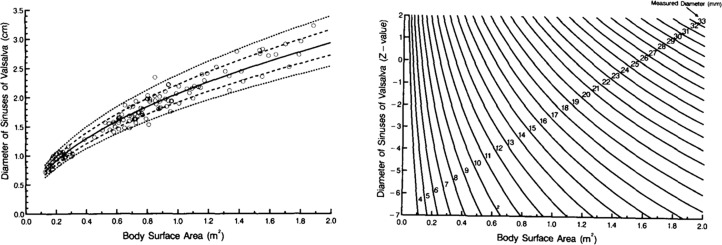
Figure 2.
Panel A. Scatterplot of individual patient data illustrating the relationship between body surface area and diameter of the Sinuses of Valsalva. Solid line = regression equation; dashed line = confidence Intervals. Panel B. Nomogram generated from the scatterplot in Panel A for determining individual Z-score according to body surface area and diameter of the Sinuses of Valsalva. Included with permission from Daubeney et al. [5].

