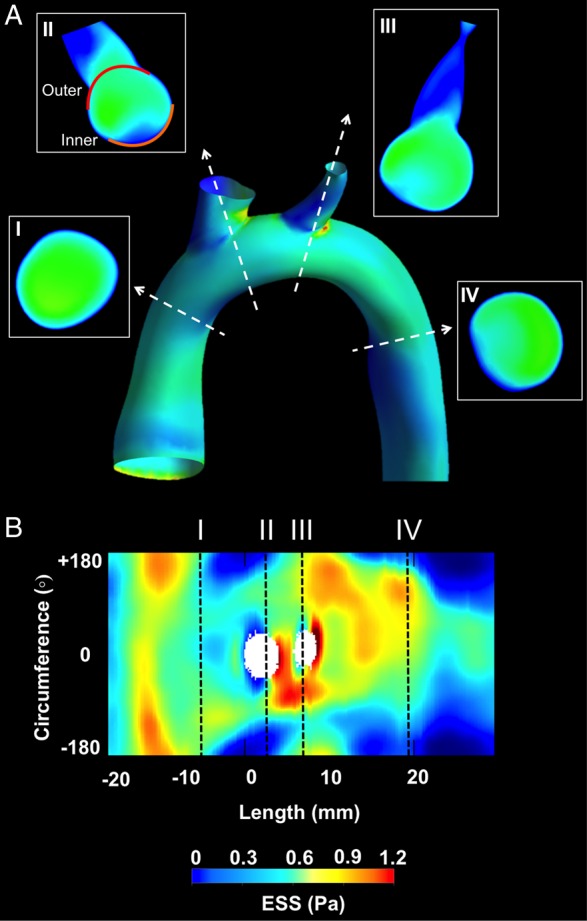
Figure 2.

Representative example of CFD in a 3D reconstructed aorta: (A) 3D reconstructed aorta and proximal parts of major branches and ESS distribution by CFD. Representative cross-sections (I–IV) at the level of the ascending aorta, aortic arch, and descending aorta. Using the take-off of right innominate artery as reference (0°), the outer (convex) 120° (II, red line) and inner (concave) 120° (II, orange line) were identified in each cross-section. (B) 2D map representation of ESS distribution; y-axis represents the vessel circumference and x-axis the vessel length. Cross-sections (I–IV) in (A) correspond to the black dashed lines. The ostia of the major aortic arch branches are also shown.
