Figure 3.
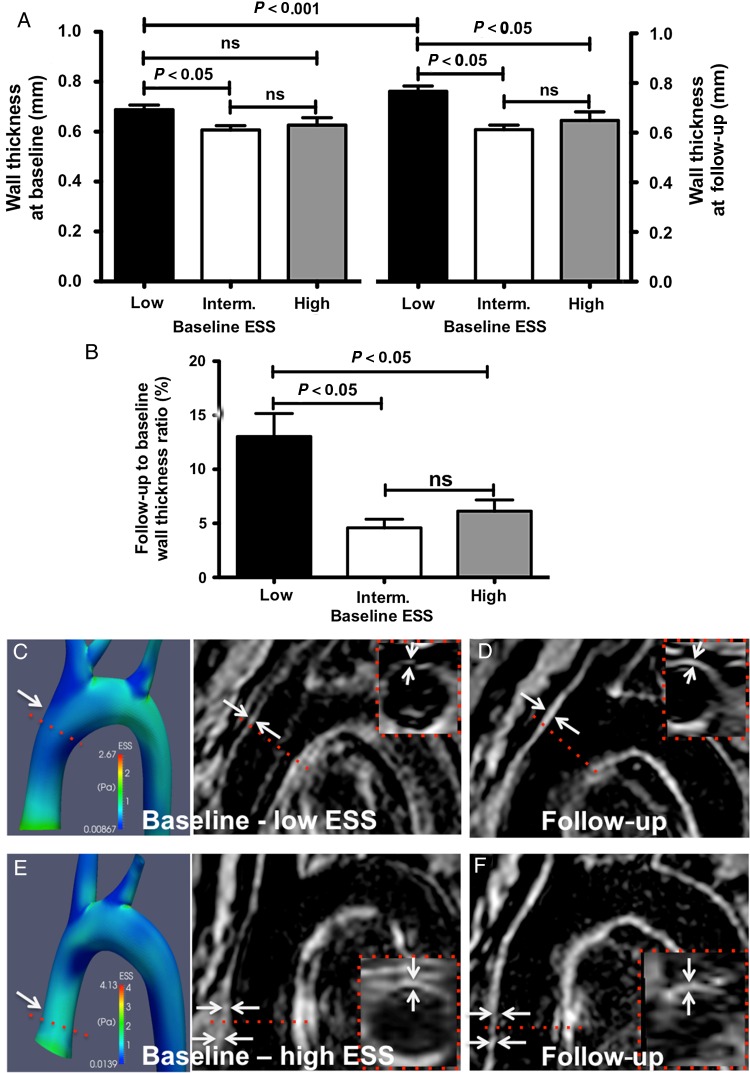
Wall thickness analysis by non-contrast MRI: (A) increased wall thickness at baseline and follow-up in subsegments with low baseline ESS compared with subsegments with intermediate or high ESS. (B) Subsegments with low baseline ESS exhibited augmented increase in wall thickness compared with intermediate or high ESS. (C–F) Representative examples of 3D reconstructed aortas and MRI images at baseline showing increased wall thickness (D, arrows, dashed lines and inserts) in regions with low ESS (C) at baseline vs. regions with high ESS (E and F).

