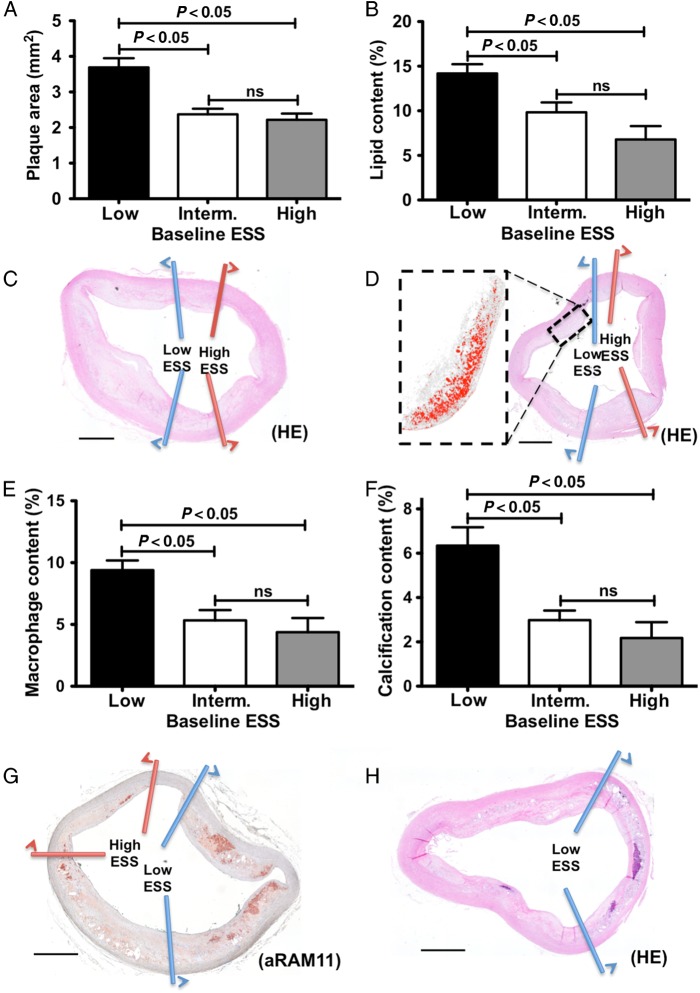
Figure 5.
Histopathology analysis and baseline ESS: increased plaque area (A), lipid content (B), macrophage accumulation (E), and calcium content (F) in subsegments with low baseline ESS compared with intermediate or high ESS. Representative images of haematoxylin–eosin (C, D, and H) and anti-RAM-11 immunostaining for inflammation (G). Magnification of lipid-rich area is shown in (D); bars represent 1000 µm.

