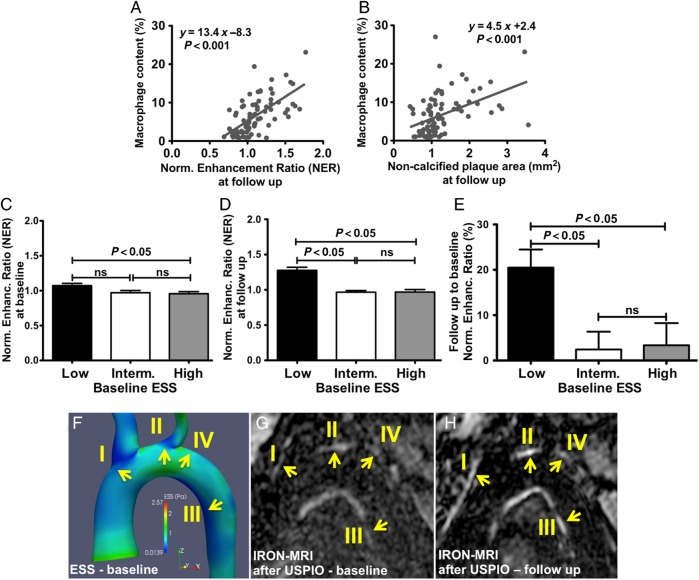
Figure 6.
Wall inflammation by USPIO-enhanced IRON-MRI and ESS: association of macrophage content by immunostaining with plaque inflammation measured as NER by USPIO-enhanced IRON-MRI (A) and with non-calcified plaque area by CTA (B). Subsegments with low ESS at baseline exhibited increased NER values at baseline (C) and follow-up (D) and increased progression of NER compared with low or intermediate ESS (E). Representative example depicting increased wall inflammation (NER) (G and H) in subsegments with low baseline ESS (I–III) vs. subsegments with high ESS (IV) (F).

