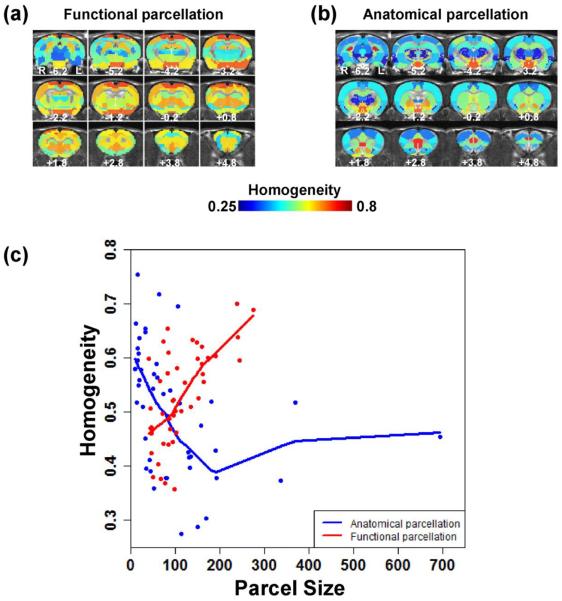
Figure 4. Comparison of parcel homogeneity between functional and anatomical parcellations.
(a) Parcel homogeneity map of the functional parcellation. (b) Parcel homogeneity map of the anatomical parcellation. (c) Homogeneity value plotted against parcel size for the two parcellation schemes. The homogeneity value of the functional parcellation is above that of the anatomical parcellation for the most majority of parcel sizes, reflected by their Lowess fit curves.

