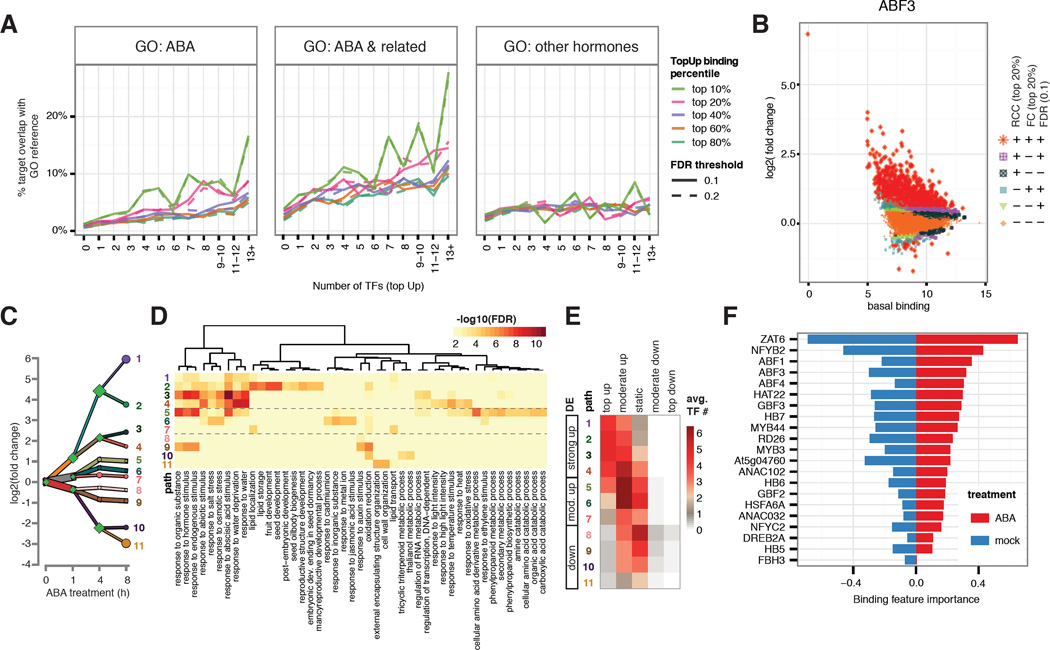
Figure 2. Dynamic TF binding triggered by ABA treatment correlates with gene function and expression.
(A) Genes targeted by higher number of TFs with dynamic binding events (x-axis) have higher percentage overlap (y-axis) with genes annotated with ABA and ABA-related GO terms, but not with GO terms specific to other hormones. This positive correlation is stronger for target genes associated with stronger dynamics (different color lines). (B) Hormone-dependent, locus-specific TF binding dynamics vary greatly across the genome. Log2 (fold change) of TF binding upon ABA treatment (y-axis) was plotted against basal binding measured as log2 (normalized read counts) under mock treatment (x-axis). Peaks were classified by three criteria: read count change (RCC, within top 20%), fold change (FC, within top 20%), and DiffBind FDR (less than 0.1). Peaks satisfying all three criteria were designated as top dynamic (+++) and those failing all three were designated as static (---). The remaining peaks were designated as moderately dynamic. (C) DREM analysis shows 11 paths of DE genes after 8 hours of ABA treatment. (D) Each DREM path is enriched for specific GO terms. (E) Level of DE is correlated with multi-TF dynamic binding. (F) Ridge regression model for differential expression at 4 hour using binding strength in both ABA- and mock-treated condition includes contribution from multiple TF in both conditions. Regression coefficients are plotted as relative importance of the binding features.

