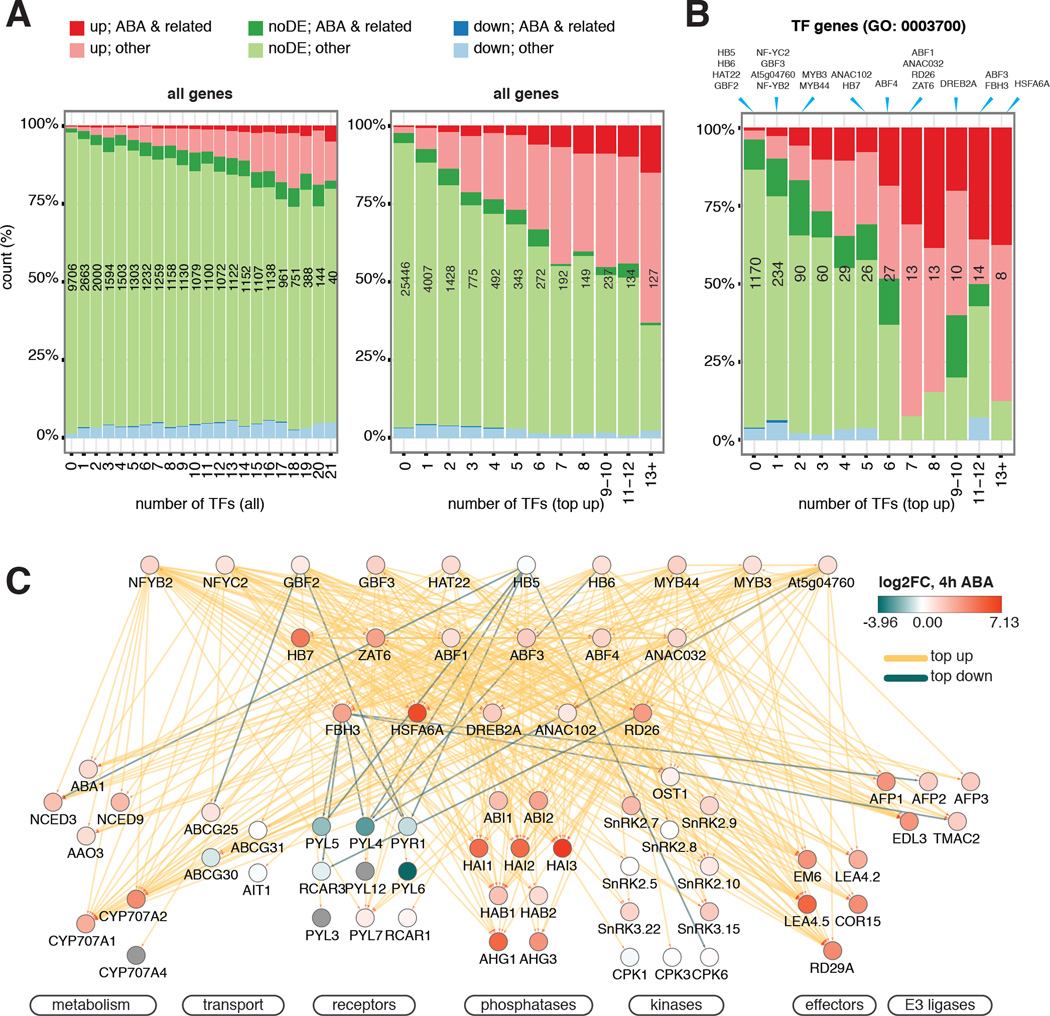
Figure 4. TF network integrates expression and connectivity features of genes in ABA response.
(A–B) Expression and functional composition of all genes (A) and TF genes (B) are grouped by the number of targeting TFs through either any kind of binding or “top up” binding. “Top up” binding is a better predictor for both ABA-related BP functions and DE than “all” binding. The number of genes in each bin is shown in black. The bins to which of the TFs included in this study belong are indicated at the top of (B). (C) ABA pathway genes are subject to extensive feedback regulations and multi-TF dynamic binding. ChIPped TFs are arranged in three tiers by normalized hierarchy height. Target genes are grouped by function. Node color depicts changes of transcript abundance after 4 hours of ABA treatment. Edge color corresponds to TF binding dynamic categories.

