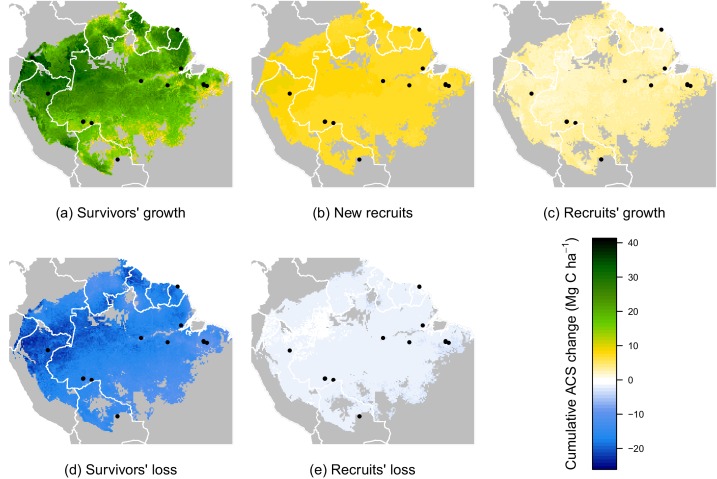
Figure 4. Predicted cumulative ACS changes (Mg C ha) over the first 10 year after losing 40% of ACS.
Extrapolation was based on global rasters: topsoil bulk density from the Harmonized global soil database (Nachtergaele et al., 2008), Worldclim precipitation data (Hijmans et al., 2005) and biomass stocks from Avitabile et al. map (Avitabile et al., 2016). Cumulative ACS changes are obtained by integrating annual ACS changes through time. We here show the median of each pixel. Top graphs are ACS gain and bottom graphs are ACS loss. (a) ACS gain from survivors’ growth. (b) ACS gain from new recruits. (c) ACS gain from recruits’ growth. (d) ACS loss from survivors’ mortality. (e) ACS loss from recruits’ mortality. Black dots are the location of our experimental sites. Survivors’ ACS changes (a and d) show strong regional variations unlike to recruits’ ACS changes (b,c and e).

