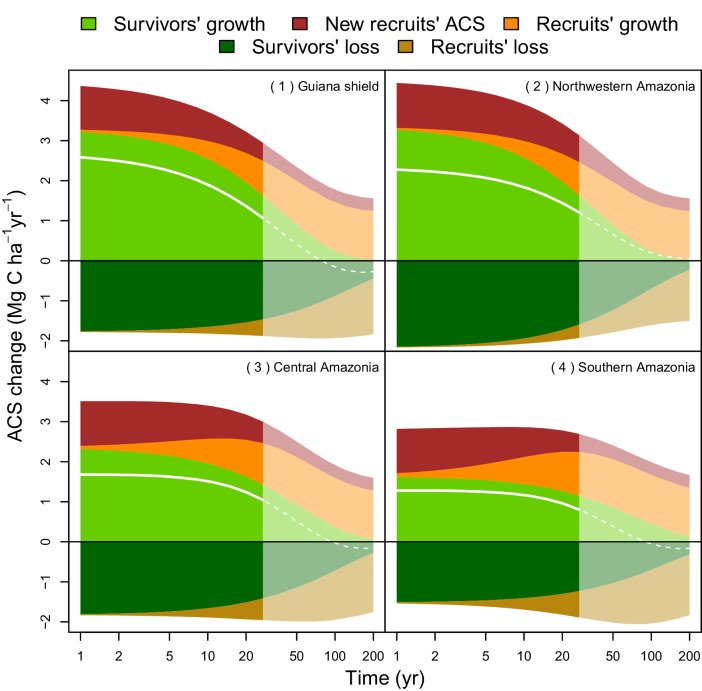
Figure 6. Predicted contribution of annual ACS changes in ACS recovery in four regions of Amazonia (Figure 5).
The white line is the net annual ACS recovery, i.e. the sum of all annual ACS changes. Survivors’ (green) and recruits’ (orange) contribution are positive for ACS gains (survivors’ ACS growth, new recruits’ ACS and recruits’ ACS growth) and negative for survivors’ and recruits’ ACS loss. Areas with higher levels of transparency and dotted lines are out of the calibration period (0–30 year). In the Guiana Shield and in nothwestern Amazonia, high levels of net ACS recovery are explained by large ACS gain from survivors’ growth. Extrapolation was based on global rasters: topsoil bulk density from the Harmonized global soil database (Nachtergaele et al., 2008), precipitation data from Worldclim (Hijmans et al., 2005) and biomass stocks from Avitabile et al. (Avitabile et al., 2016) map.

