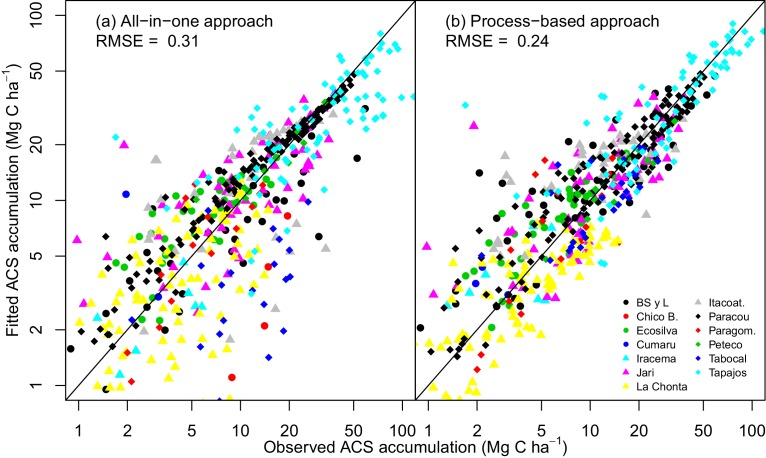
Appendix 1—figure 1. Observed vs fitted values of net ACS accumulation (MgC ha).
(a) Fitted values from the all-in-one model. (b) Fitted values from the process-based model (right). Net ACS accumulation is the sum of cumulative ACS changes (gain and loss). Each combination of a colour and shape is specific to a site. The closer the dots are to the x=y line, the better the prediction.

