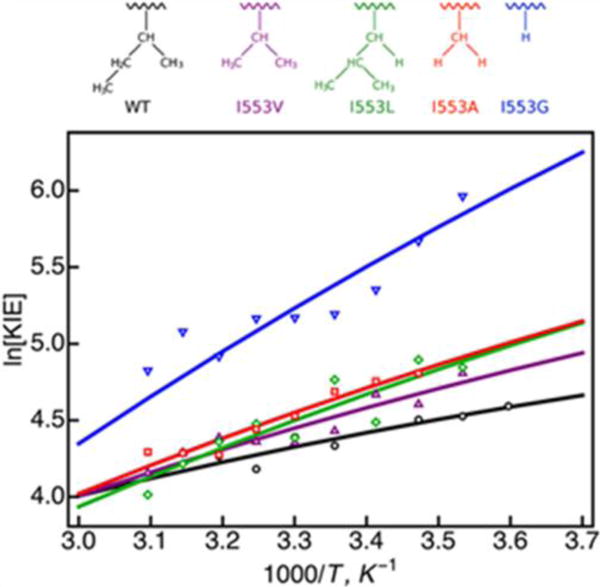
Figure 4.

KIE versus inverse temperature for WT SLO and the series of I553 mutants. The lines were obtained from calculations using the analytical expression with quadratic terms, as given in Eq. (2), in conjunction with the parameters given in Table 1. Open symbols are the experimental data from Ref.1. The color scheme corresponds to the I553 mutants with residues depicted above the plot: WT (black), I553V (purple), I553L (green), I553A (red), and I553G (blue).
