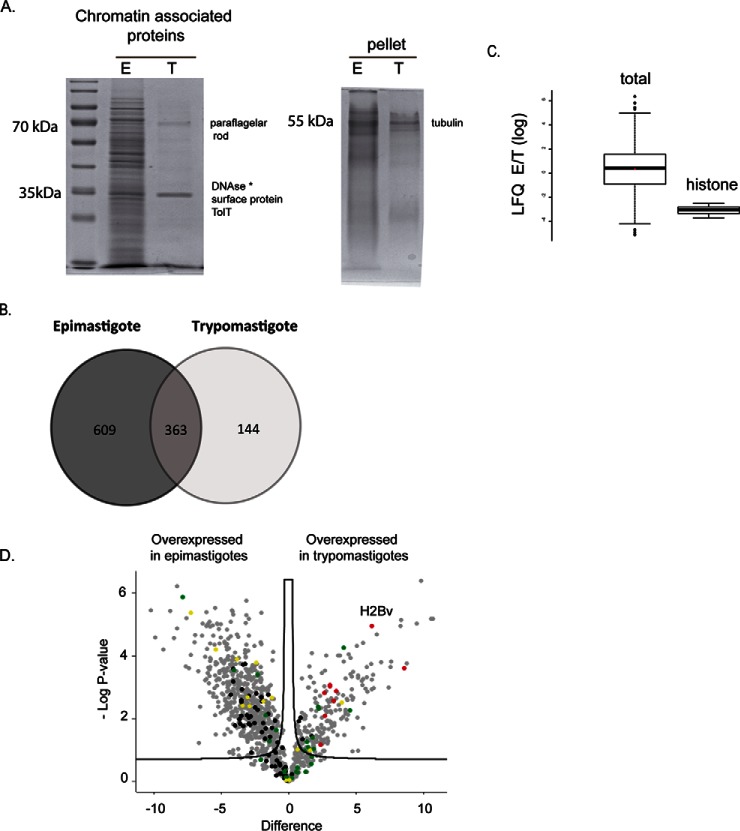
Fig. 3.
A, SDS-PAGE analysis of chromatin-extracts (protocol 2) from epimastigotes and trypomastigotes normalized by number of cells. At left, proteins obtained from supernatant of DNase treatment, at right, the remaining pellet that were solubilized with Coomassie sample buffer. B, Venn diagram showing a comparison of proteins identified exclusively in epimastigotes (609) and trypomastigotes (144) forms and those proteins found in both forms (363) after chromatin extraction and MS analysis. C, Comparison of LFQ ratios (in log scale) of epimastigotes and trypomastigotes from all chromatin associated proteins (left) and from histones (right). * Deoxyribonuclease-1 from Bos taurus. D, Volcano plot of chromatin-associated proteins from epimastigotes and trypomastigotes. Differentially expressed proteins were obtained considering p value <0.05 and s0 = 0.2. Missing data were imputed by normal distribution. Ribosomal (black), histone (red) and cytoskeleton proteins (green) and RNA binding proteins (yellow).

