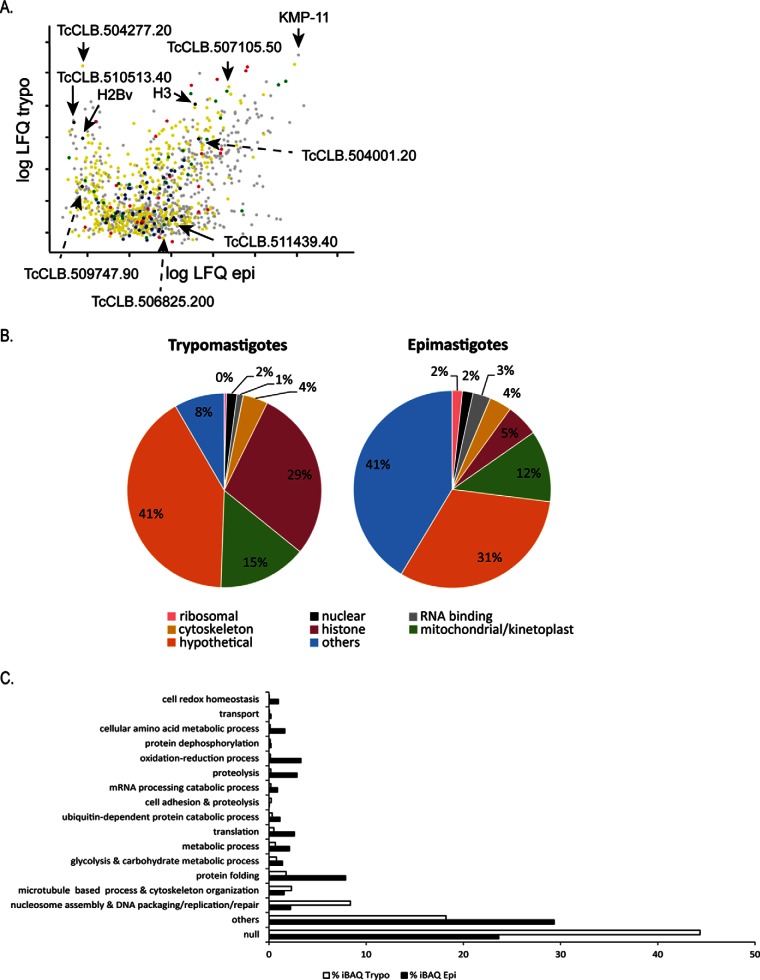
Fig. 4.
Absolute abundance evaluation using iBAQ. A, Scatter plot of iBAQ values of chromatin-associated proteins from epimastigotes and trypomastigotes. Protein extracts were obtained by using protocol 2. Hypotheticals (yellow), ribosomal (black), histone (red) and cytoskeleton proteins (green) are shown. B, Relative percentage of iBAQ values according to the indicated categories. Note that 29% of trypomastigotes extracts correspond to histone proteins. C, GO process terms and their corresponding percentage of iBAQ values in epimastigotes and trypomastigotes.

