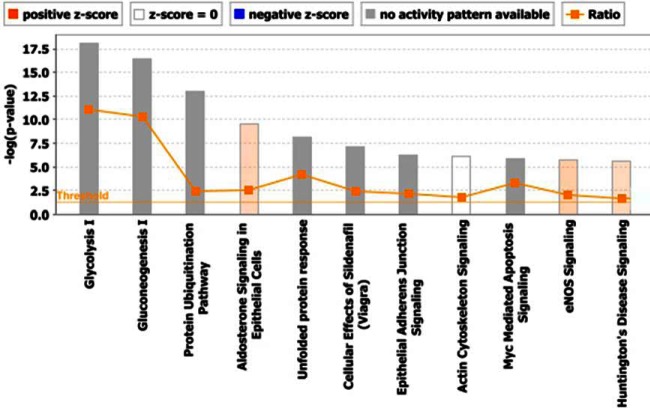
Fig. 7.
Canonical pathways: Total proteins in sperm cell proteomic data set were analyzed for Ingenuity Pathway Analysis “Core analysis” and the top canonical pathway enriched are shown here. Horizontal orange line running through the bars is the threshold for p value for these pathways's enrichment. Color coding for positive and negative z-score and for pathways with no activity pattern available are shown in the figure.

