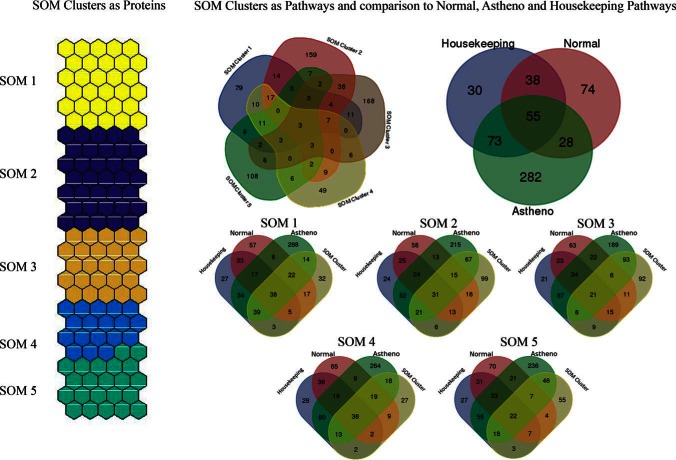
Fig. 9.
Five clusters found by SOM in sperm cell proteomic data set are shown here. Pathway over-representation analysis was done on clusters and highest mean NZS and highest mean AZS and housekeeping proteins using IMPaLA tool. These pathways were compared with each other and the comparisons are shown in the form of Venn diagram.

