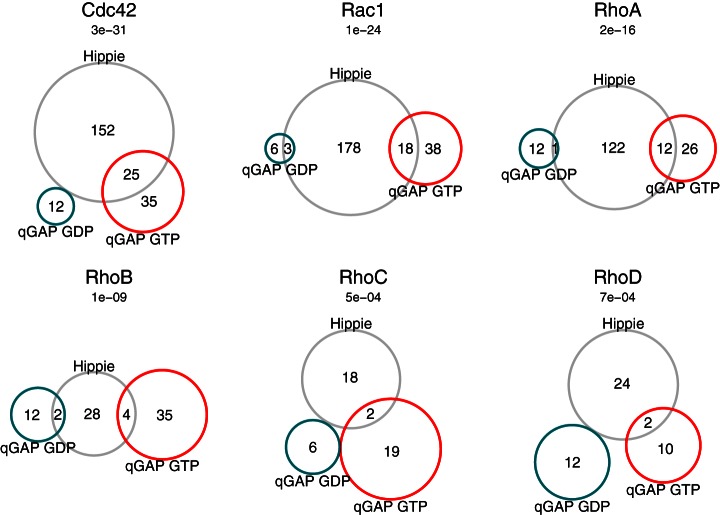
Fig. 4.
Overlap with published interactions. Interactors identified by qGAP (GDP specific interactors in turquoise; GTPγS specific interactors in red) with interactors listed in the HIPPIE protein-protein interaction Database (gray circle). p values indicate significance of the enrichment of overlapping interactors between qGAP and HIPPIE and are given above each Venn diagram.

