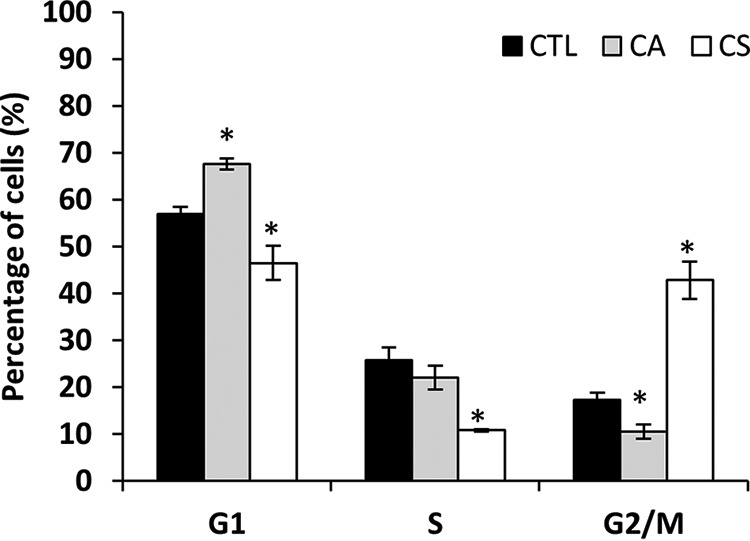
Fig. 1.

Cell cycle distribution determined by flow cytometry of HT-29 cells incubated with or without TGI concentration of CA or CS for 24 h (* indicates significant differences between the treated and control samples as determined by t test, p < 0. 05).
