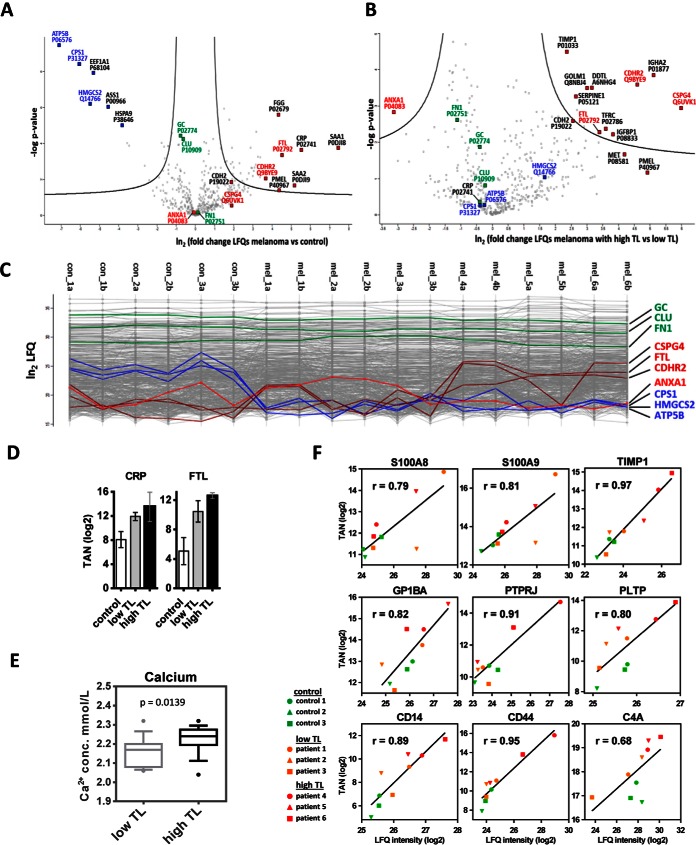
Fig. 1.
Regulation of proteins in serum from melanoma patients. Differences of LFQ values (logarithmic scale base two) of proteins determined in serum samples from melanoma patients versus controls (A), as well as from melanoma patients with high tumor load (high TL) or low tumor load (low TL) (B), with corresponding p values (logarithmic scale base 10), are represented as volcano plots. The area above the two black lines encompasses at least 2-fold significantly regulated proteins with a global FDR<0.05 as determined by a permutation-based method. C, Profile plots showing LFQ values (logarithmic scale base two) obtained from each individual measurement. Values for non-regulated proteins (green), proteins upregulated upon escalation of melanoma (dark red), proteins which were downregulated in melanoma versus control serum samples (blue), and one protein (ANXA1) which was upregulated in low TL, but downregulated in high TL (light red) are highlighted. Patients annotated as mel_4a to mel_6b showed increased levels of melanoma marker molecules D, Results from targeted analyses showing that CRP levels were similar in serum samples from patients with high TL or low TL, but elevated in patients with metastatic melanoma in comparison to controls. Progressive FTL increase associated with high TL melanoma was also determined with targeted analysis; TAN, log2 of normalized total peak area for a selected peptide. E, Calcium levels, as determined in clinics, were higher in serum samples from patients with high TL in comparison to low TL melanoma. Boxplots represent data collected in a four month period of time and consist of 15 samples per group. F, Correlation of quantification data obtained fom MRM and shotgun analyses. TAN, log2 of the normalized total peak area for proteins obtained by MRM; LFQ intensity, log2 of the label-free quantification value obtained by shotgun analysis; r, Pearson correlation coefficient.

