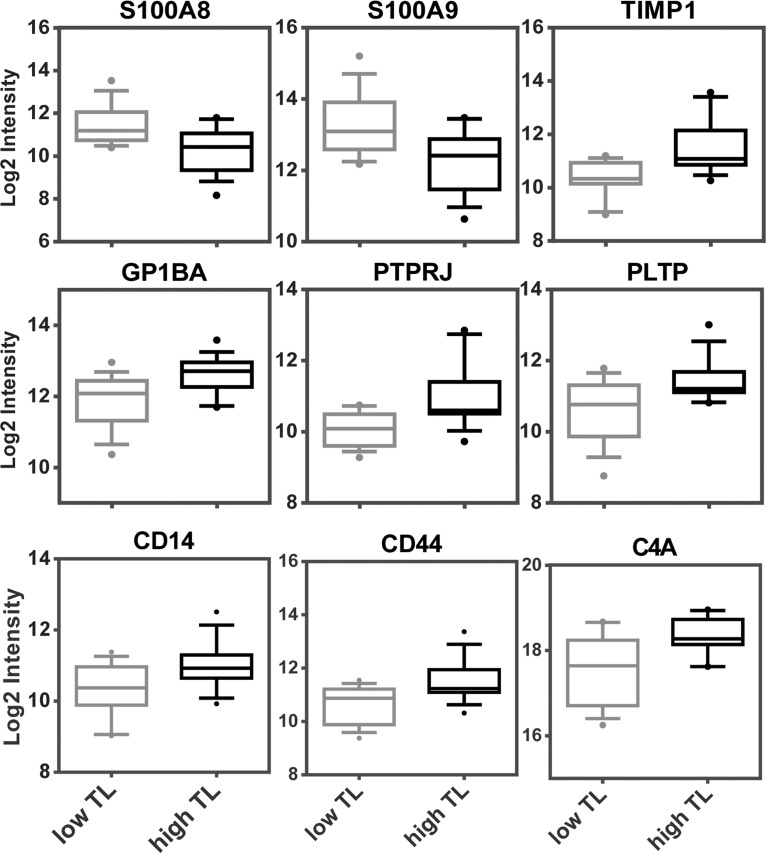
Fig. 2.
Results of targeted proteomics analyses. The MRM analysis revealed nine proteins which were significantly up- or downregulated in serum samples from patients with with high TL or low TL. For statistical analysis, the MSStats software was used and the significance threshold was set to a fold change higher than 1.5 with a p value lower than 0.05. Sample quantification data from MSStats are represented as log2 intensities.

