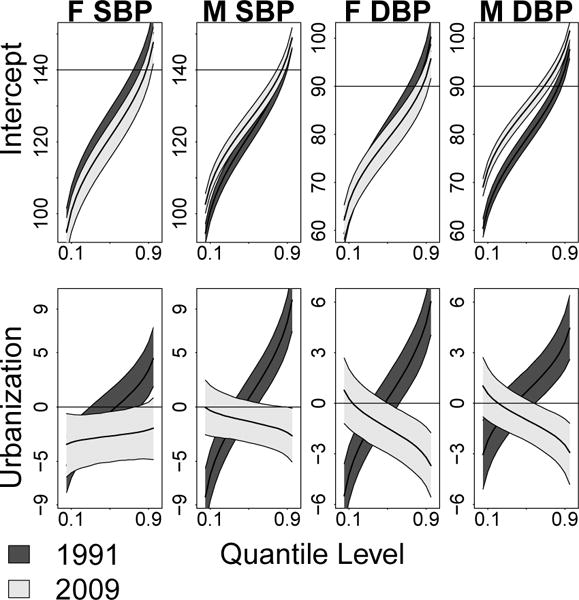
Fig 4.

Plots of the intercept process for the age 40–50 cohort and population urbanicity effects by gender and blood pressure type. The intercept process is the distribution of the response when all covariates are 0. The urbanicity plots are the effects of a one standard deviation increase in urbanicity on the τth quantile of blood pressure. Dark regions correspond to 1991 estimates, while light regions correspond to 2009 estimates.
