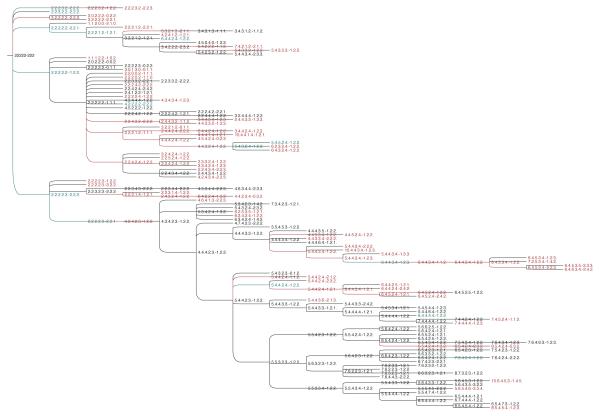
Fig. 1.
Predicted progression from DCIS to IDC for the dataset DAT01. For ease of interpretation, each sample is represented by a sequence of numbers separated by dots and a dash. Specifically, the first five numbers represent the copy numbers for the oncogenes COX2, MYC, HER2, CCND1 and ZNF217 and the last three numbers represent the copy numbers for the tumor suppressor genes DBC2,CDH1 and TP53. The samples in black and red refer to DCIS or IDC single-cells, respectively. The samples in blue refer to single-cells found in both DCIS and IDC.

