
Fig. 5.
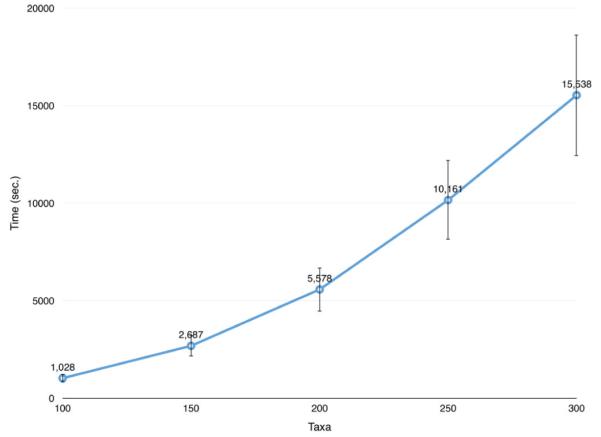
Average computation times taken by Formulation (18) to solve instances of the problem containing 100, 150, 200, 250 and 300 taxa, respectively. The vertical bars indicate the standard deviations.
Official websites use .gov
A
.gov website belongs to an official
government organization in the United States.
Secure .gov websites use HTTPS
A lock (
) or https:// means you've safely
connected to the .gov website. Share sensitive
information only on official, secure websites.
Average computation times taken by Formulation (18) to solve instances of the problem containing 100, 150, 200, 250 and 300 taxa, respectively. The vertical bars indicate the standard deviations.