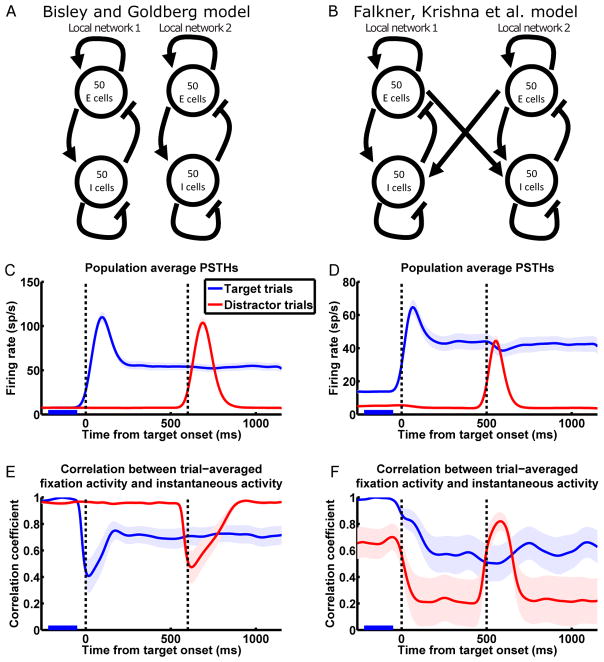
Figure 2.
Model reproduces the response and network dynamics of Bisley and Goldberg (2003; left column) and Falkner, Krishna et al. (2010; right column).
(A and B) Schematics of the model network connectivity for the BG (A) and the FK (B) scenarios. In both cases we model two recurrently connected local LIP networks (together referred to as a global network) corresponding to two RF locations, with each LN consisting of E and I cells. Connectivity within each LN is such that each LN by itself amplifies a single multi-neuronal activity pattern much more strongly than other patterns (see Results for details). The FK model network (B) differs from the BG model network (A) in the addition of coupling between the LNs that mediates interaction between them.
(C and D) Model reproduces LIP activity patterns observed by BG (C; n = 41 cells; in all simulation results except where noted, each neuron was “recorded” from a different simulated global network) and FK (D; n = 27). Population average PSTHs with same conventions as Fig. 1C and D. PSTHs have been smoothed by convolution with a Gaussian kernel (σ = 30 ms; firing rates and correlations appearing to change before stimuli onset in Fig. 2C–F are artifacts of this smoothing).
(E and F) Model reproduces LIP network dynamics observed by BG (E) and FK (F). Correlation analysis with same conventions as Fig. 1E and F.
See Fig. S1B for correlations between distractor trials fixation activity and instantaneous activity of the FK simulation, and Fig. S2E–H for separate simulations of the different reward conditions of the FK experiment.

