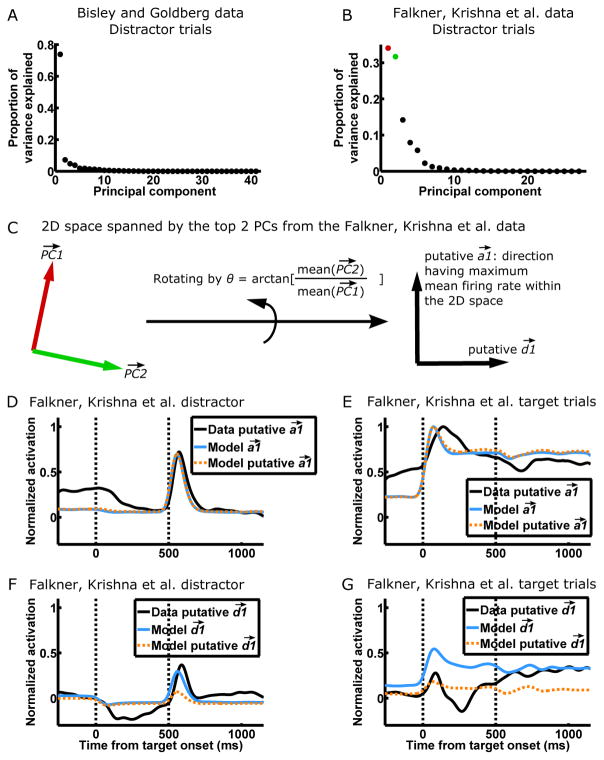
Figure 5. Direct evidence for two-dimensional dynamics in the Falkner, Krishna et al. dataset.
(A and B) PCA, where the variables are neurons and the observations are the instantaneous activity vectors during distractor trials, for the BG (A) and FK (B) datasets. Activity vectors during the transient visual responses to the distractor (600–1100 ms after target onset for BG, 450–750 ms after target onset for FK) were not included for this analysis because they involve activation of weak patterns. The majority of the variance is explained by one PC in BG, while a comparable proportion is explained by two PCs in FK, consistent with one-dimensional dynamics in BG and two-dimensional dynamics in FK.
(C) We hypothesize that the 2D space spanned by the top 2 PCs (colored as in B) in the FK data is the 2D space of and (Fig. 3C and Fig. 4C, G). We further hypothesize that the direction having the maximum mean firing rate within the 2D space of the 2 PCs is the putative direction, since represents concerted firing of neurons in an LN. We can thus find the putative and of the FK data by rotating the two PCs by an angle of arctan[mean( )/mean( )], where mean(•) denotes mean over the elements of a vector.
(D–G) The activation of (D–E) and (F–G) on FK distractor trials (D and F) and target trials (E and G). In D–E, the data putative was derived as in C. To determine activation in the model, one cell was “recorded” from each of multiple simulated global networks to form the model population. To determine the model , suppose the ith cell of the model population is the jth cell from LN1 of the ith global network. Then the ith element of the model is the jth element of the actual of the ith global network. The model putative was derived as in C but from the model population. The directions are determined similarly. Each set of activations (e.g. the four activation traces of data putative and on target and distractor trials comprise a set) is normalized by its peak activation on target trials—thus, DG share the same scale. Vertical dashed lines denote the onsets of the target and distractor.

