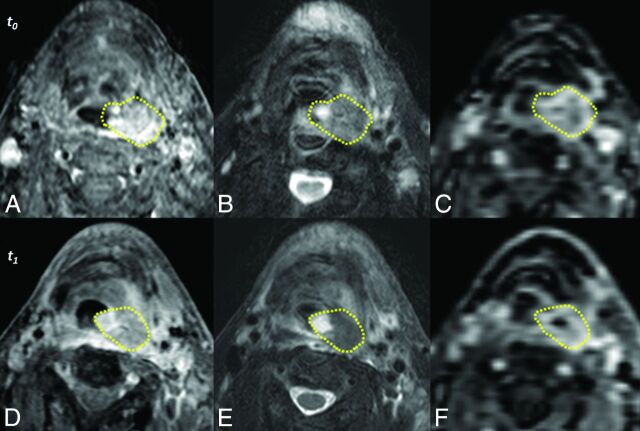
Fig 2.
Unregistered sequences of a representative subject acquired before treatment (t0, top row) and 2 weeks after initiation of therapy (t1, bottom row). Acquisitions include postcontrast T1-weighted with fat-saturation (A and D), T2-weighted with fat-saturation (B and E), and DCE MR imaging (C and F). Manually defined primary gross tumor volumes are depicted for each time point (yellow lines). The images above are those of subject 3, a nonsurvivor at follow-up.

