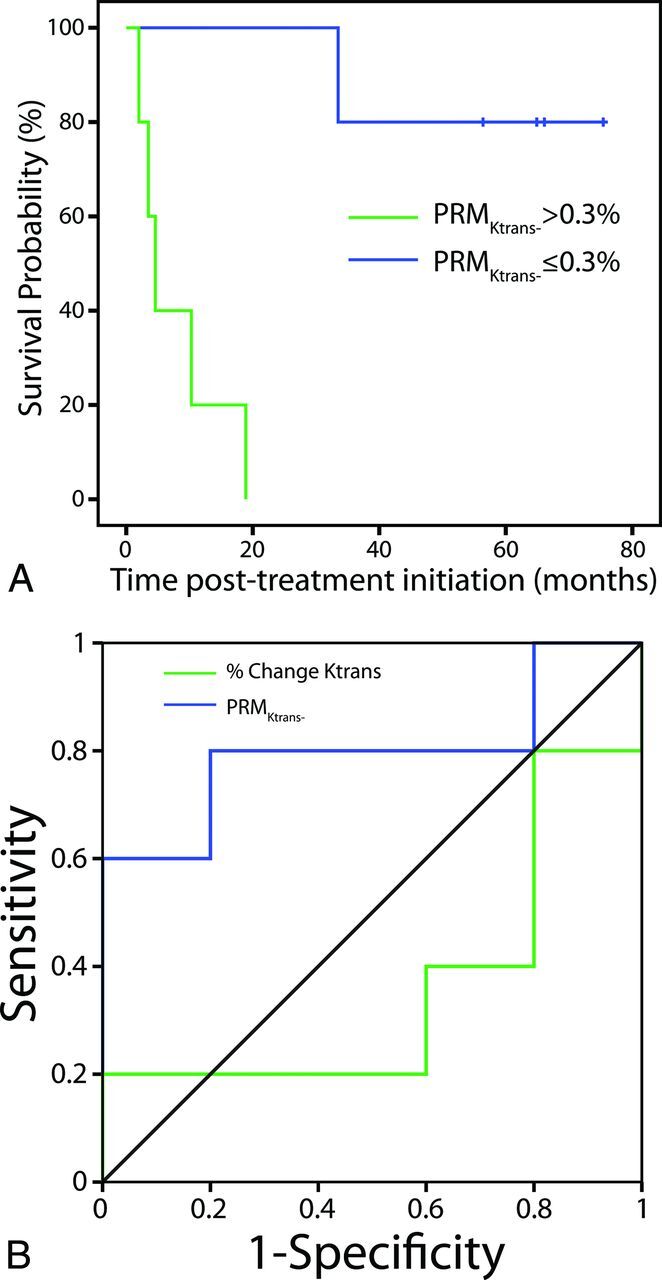
Fig 3.

ROC curves for PRMKtrans− (blue line) and PRMKtrans0 (green line) at 2 weeks after treatment initiation (A). Kaplan-Meier survival plots for overall survival as a function of stratification by PRMKtrans− (the perfusion parameter most predictive of survival) at 2 weeks after treatment initiation (B). The blue line represents PRMKtrans− ≤ the cutoff. The green line represents PRMKtrans− > the cutoff.
