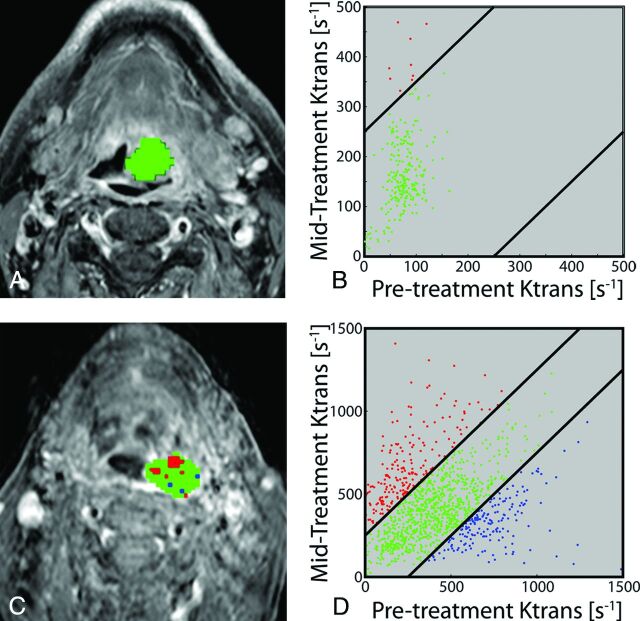
Fig 4.
Representative patients with HNSCC stratified by PRMKtrans− as survivor (top row, median survival time, 64.9 months) or nonsurvivor (bottom row, median survival time, 10.3 months) at the time of analysis. PRMKtrans color-coded ROIs are superimposed on pretreatment T1-weighted gadolinium contrast-enhanced images (A and C). The scatterplots illustrate the distribution of changes in Ktrans throughout the entire volumes of interest (B and D). The 95% confidence intervals within the scatterplots are represented by the black lines. Voxels with significantly increasing, decreasing, or unchanged Ktrans are coded as red, blue, and green dots, respectively.

