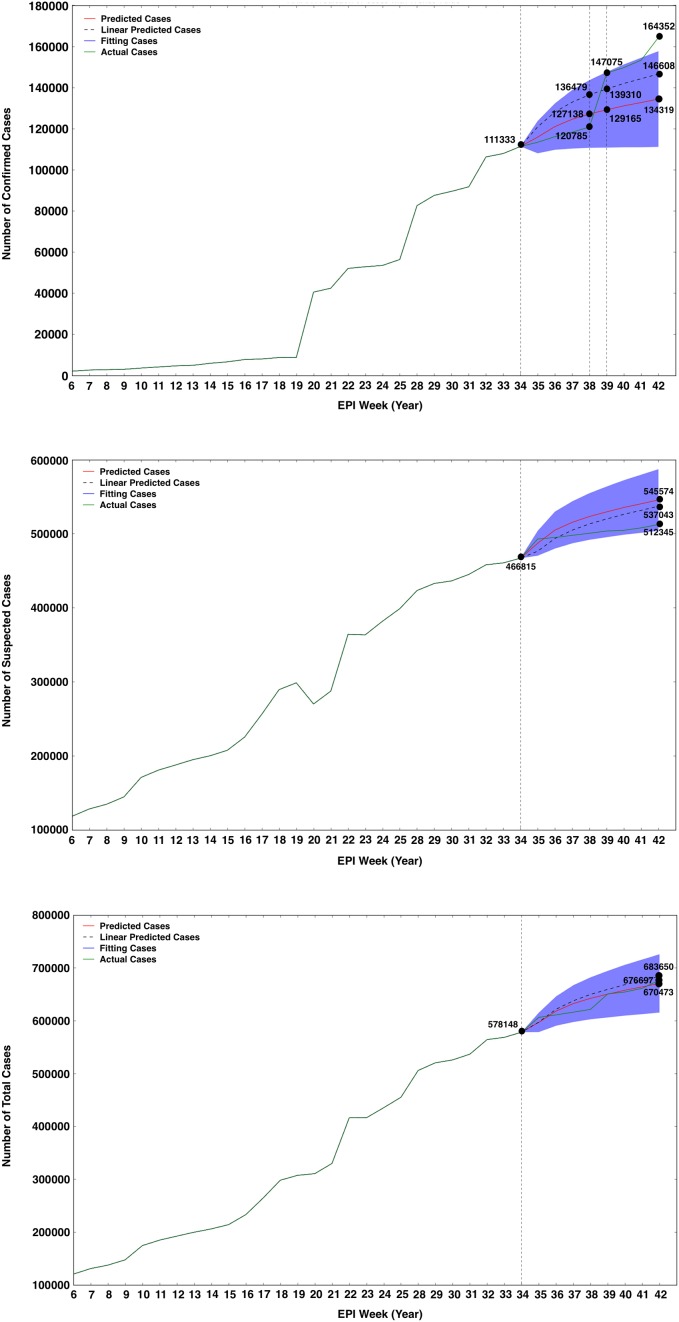
Fig 3.
Numbers of reported confirmed cases (A), suspected cases (B) and total cases (C) in the testing set compared with the simulation data by the advanced ARIMA (0, 1, 3) model for training set using the data of Google Trends as the external regressor. The red, blue and green solid lines represent the predicted, training and actual number of cases, respectively. The black dash lines represent the prediction of the linear baseline model. The blue region represents the 95% confidence interval predicted by the ARIMA (0, 1, 3) model.

