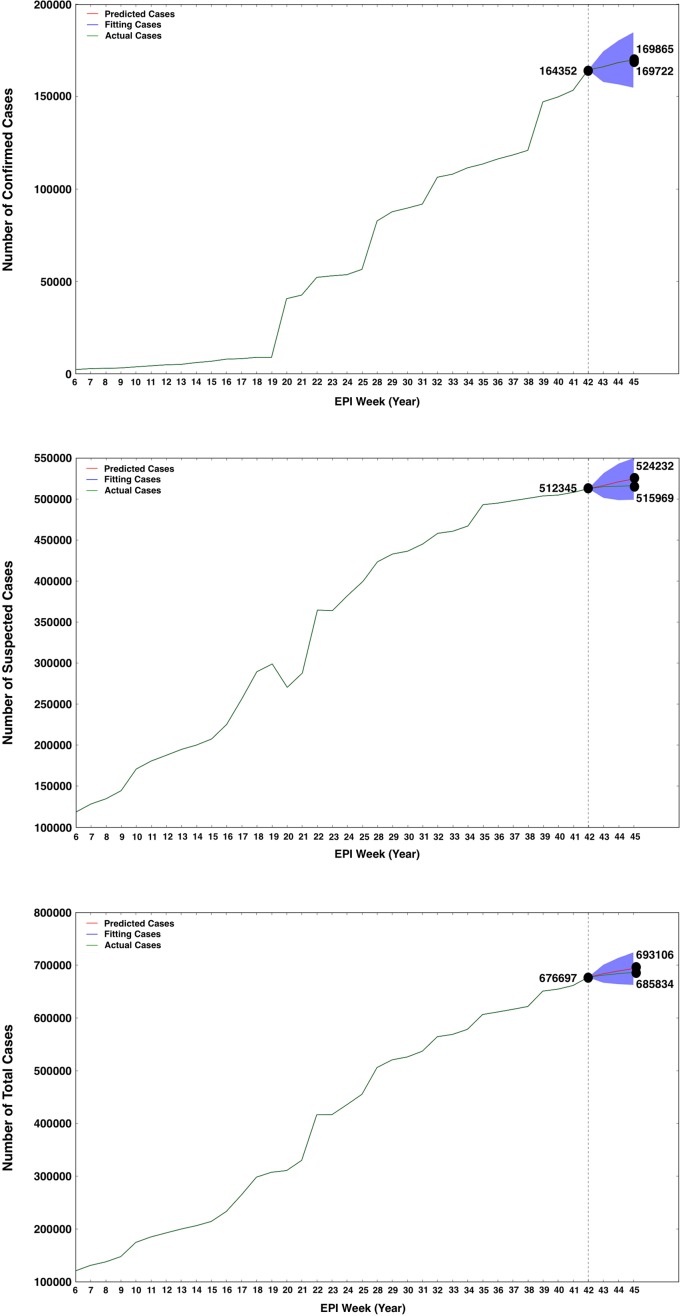
Fig 4.
Forecasts of the number of ZIKV confirmed cases (A), suspected cases (B) and total cases (C) in worldwide between 27 October and 9 November 2016 (Yearly EPI Week 43 and 45) by the advanced ARIMA (0, 1, 3) model, which was improved by aggregating historical logs with the most-current 3 weeks’ data of Zika-related Google Trends as a estimating predictor to estimate ZVD cases. The red, blue and green solid lines represent the predicted, training and actual number of cases. The blue region represents the 95% confidence interval predicted by the ARIMA (0, 1, 3) model.

