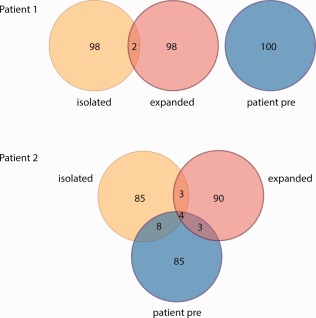
Figure 1.

Regulatory T cell (Treg) clonotype overlap between stem cell donor and recipient. High‐throughput T cell receptor (TCR)‐α chain sequencing was used to define distinct Treg clonotypes. Shown are Venn diagrams illustrating overlap in the 100 most frequent Treg clonotypes found in donor‐derived Treg before (yellow), after ex‐vivo expansion (red) and the recipient prior to Treg infusion (blue). Upper diagram = patient 1, lower diagram = patient 2. Numbers illustrate numbers of distinct Treg clonotypes.
