Figure 3.

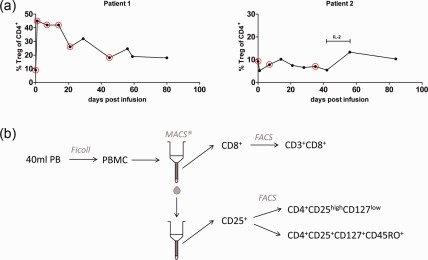
Monitoring of peripheral regulatory T cell (Treg) in patients before and after Treg transfer over time. (a) Percentages of CD4+CD25highCD127lowFOXP3+ T cells (Treg) within the CD4+ compartment were determined by flow cytometry. Circles indicate visits where additional blood samples were drawn for TCR‐α sequencing studies. IL‐2: patient 2 received low‐dose IL‐2 treatment later for the indicated time‐frame. Left graph = patient 1, right graph = patient 2. (b) Layout of the cell isolation process for high‐throughput TCR‐α sequencing. Peripheral blood mononuclear cells (PBMC) were isolated by Ficoll density centrifugation from 40 to 50 ml of whole peripheral blood. CD8+ cells were enriched by magnetic activated cell sorting (MACS) and subsequently sorted according to the expression of CD3 and CD8. The CD8– fraction was enriched for CD25 expression and sorted into Treg (CD4+CD25highCD127low) and CD4+ memory T effector cells (CD4+CD25+CD127+CD45RO+).
