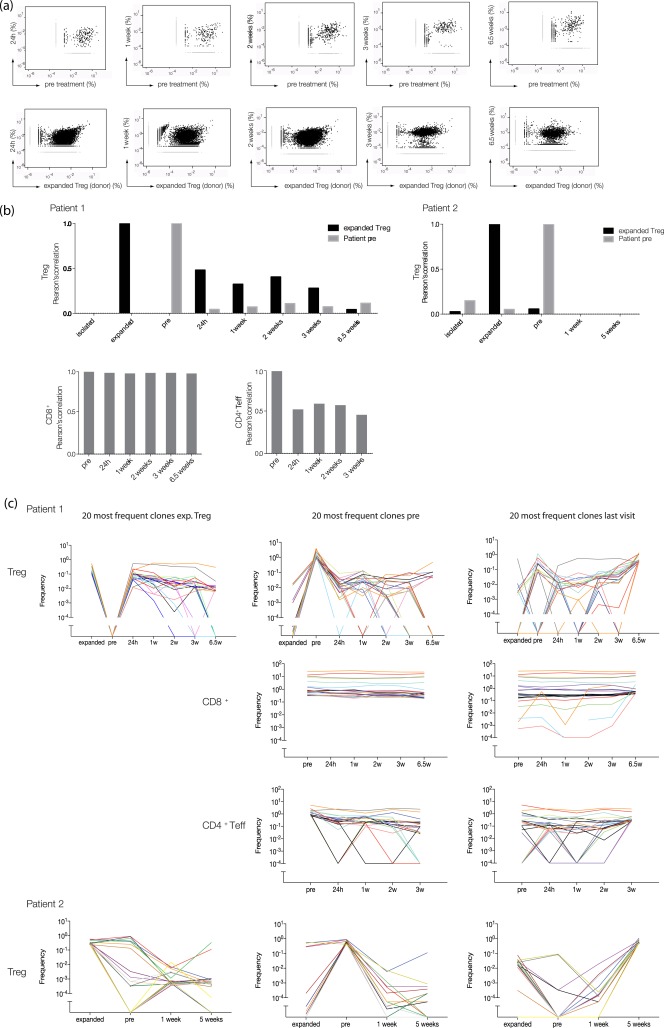
Figure 4.

Monitoring of regulatory T cell (Treg) T cell receptor (TCR) repertoire changes after Treg infusion. (a) Comparative frequency analysis of Treg clonotypes using high‐throughput TCR‐α chain sequencing. Scatterplots were generated to compare relative abundance of Treg TCR sequences at different time‐points post‐Treg transfer to their relative frequencies (in %) pretreatment (first row) or to the relative frequencies (in %) of the sequences within the expanded Treg pool (second row). Each dot represents a unique sequence. Sequences that were found only in one of the two compared samples are shown as light grey symbols. (b) Correlation analysis of the Treg repertoires. Shown are Pearson's correlation coefficients as measures of the strength of the association between the TCR repertoire at different time‐points post‐Treg transfer versus the TCR repertoire pre‐Treg therapy (grey bars) or versus the TCR repertoire of the expanded Treg pool (black bars). Bar graph on left = patient 1, bar graph on the right = patient 2. (c) Tracking of the 20 most frequent Treg clones of each sample over time. Every coloured line represents a particular clone. Plots on left: the 20 most abundant Treg clones within the expanded Treg pool followed throughout the indicated timepoints pre‐ and post‐adoptive transfer for patient 1 (first row) and patient 2 (bottom row). Middle column: the 20 most frequent Treg clones pre therapy and their frequencies over time (first row, patient 1; bottom row, patient 2). Second and third rows show the same analysis for CD8+ T cells and CD4+ effector memory T cells [CD4+ T effector (Teff)] isolated from patient 1. Plots on right: the 20 most abundant Treg clones at the last visit post‐Treg transfer and their frequencies before (first row: patient 1, last row: patient 2). The same analysis was conducted for CD8+ (second row) and CD4+ Teff (third row) from patient 1.
