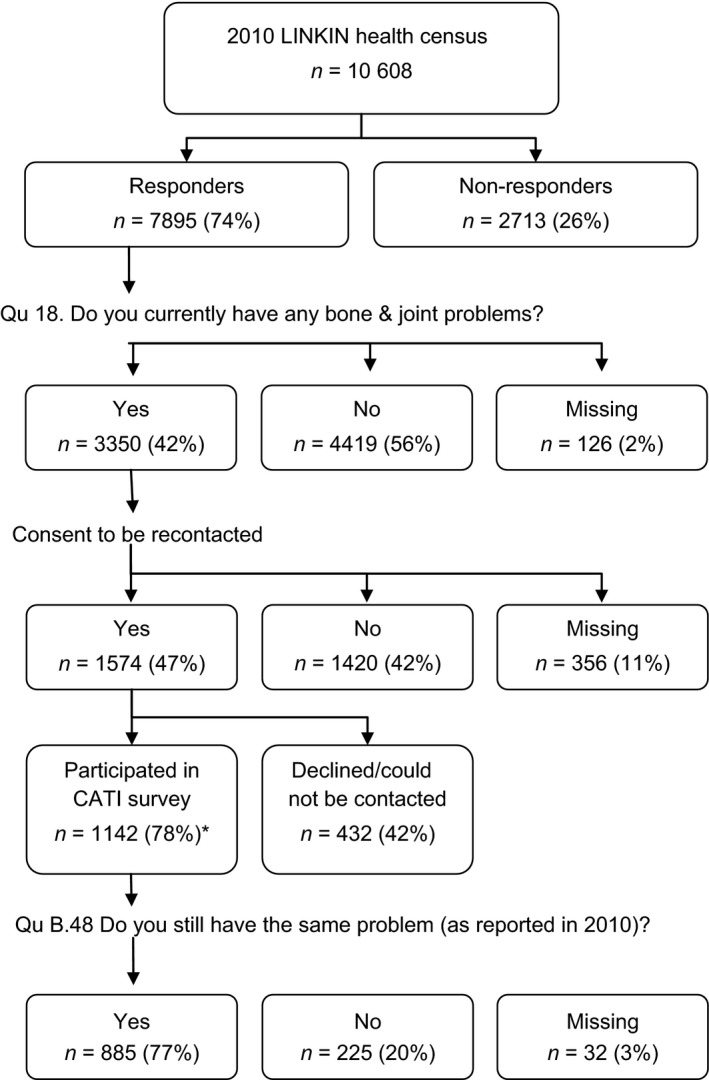
Figure 1.

Flowchart of response rates. *Percentage of the eligible computer‐assisted telephone interview (CATI) sample that includes those health census respondents who consented to be recontacted minus those deceased or moved from the region.

Flowchart of response rates. *Percentage of the eligible computer‐assisted telephone interview (CATI) sample that includes those health census respondents who consented to be recontacted minus those deceased or moved from the region.