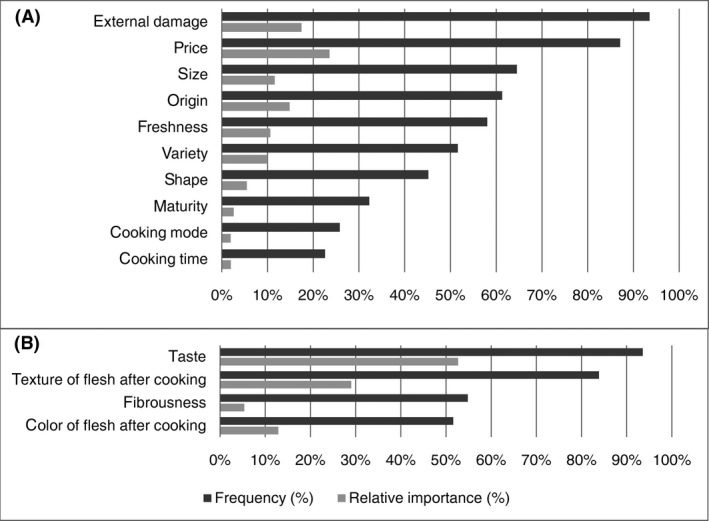
Figure 1.

Frequency and relative importance (I_%) of the purchasing (A) and consumption (B) criteria of the participants. Frequency of the criteria represents the number of times the criteria were cited by the participants while Relative Importance represents the ranking of the criteria by the participants
