
Figure 4.
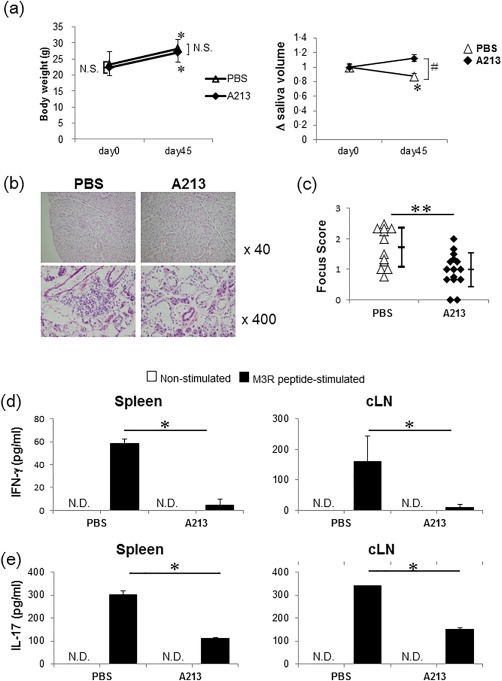
Post‐transfer treatment with A213 for murine autoimmune sialadenitis (MIS). (a) Saliva was collected from recombination‐activating gene 1 (Rag‐1)–/– mice after adoptive transfer. The saliva volume was measured on days 0 and 45, adjusted for body weight, and calculated relative to the volume measured at baseline. [A213‐ and phosphate‐buffered saline (PBS)‐treated mice (each, n=15)]. Statistical significance was determined by Student's t‐test. # P < 0·05 (A213 versus PBS at day 45 after adoptive transfer), *P < 0·05 (day 45 versus day 0 after adoptive transfer). (b) Comparison of haematoxylin and eosin (H&E)‐stained salivary gland sections of muscarinic acetylcholine receptor (M3R)–/–→Rag‐1–/– mice post‐transfer treated with A213 and PBS on day 45. Representative images obtained from 12 to 14 mice per group. (c) Comparison of histological focus score of inflammatory lesions in salivary glands of M3R–/–→Rag‐1–/– mice post‐transfer treated with A213 and PBS on day 45. The focus score was assessed in a blinded manner. Data are mean ± standard deviation (s.d.) of 12–14 mice per group. **P < 0·005 (Student's t‐test). (d,e) Splenocytes (left panel) and cervical lymph node (cLN) cells (right panel) obtained from M3R–/–→Rag‐1–/– mice on day 45 post‐transfer treated with A213 or PBS were cultured with or without M3R peptide mixture. Interferon (IFN)‐γ (d) and interleukin (IL)‐17 (e) levels in culture supernatants were analysed by enzyme‐linked immunosorbent assay (ELISA). Data are mean ± standard error of the mean (s.e.m.) of six mice per group. *P < 0·05 (Student's t‐test) not detected (n.d.).