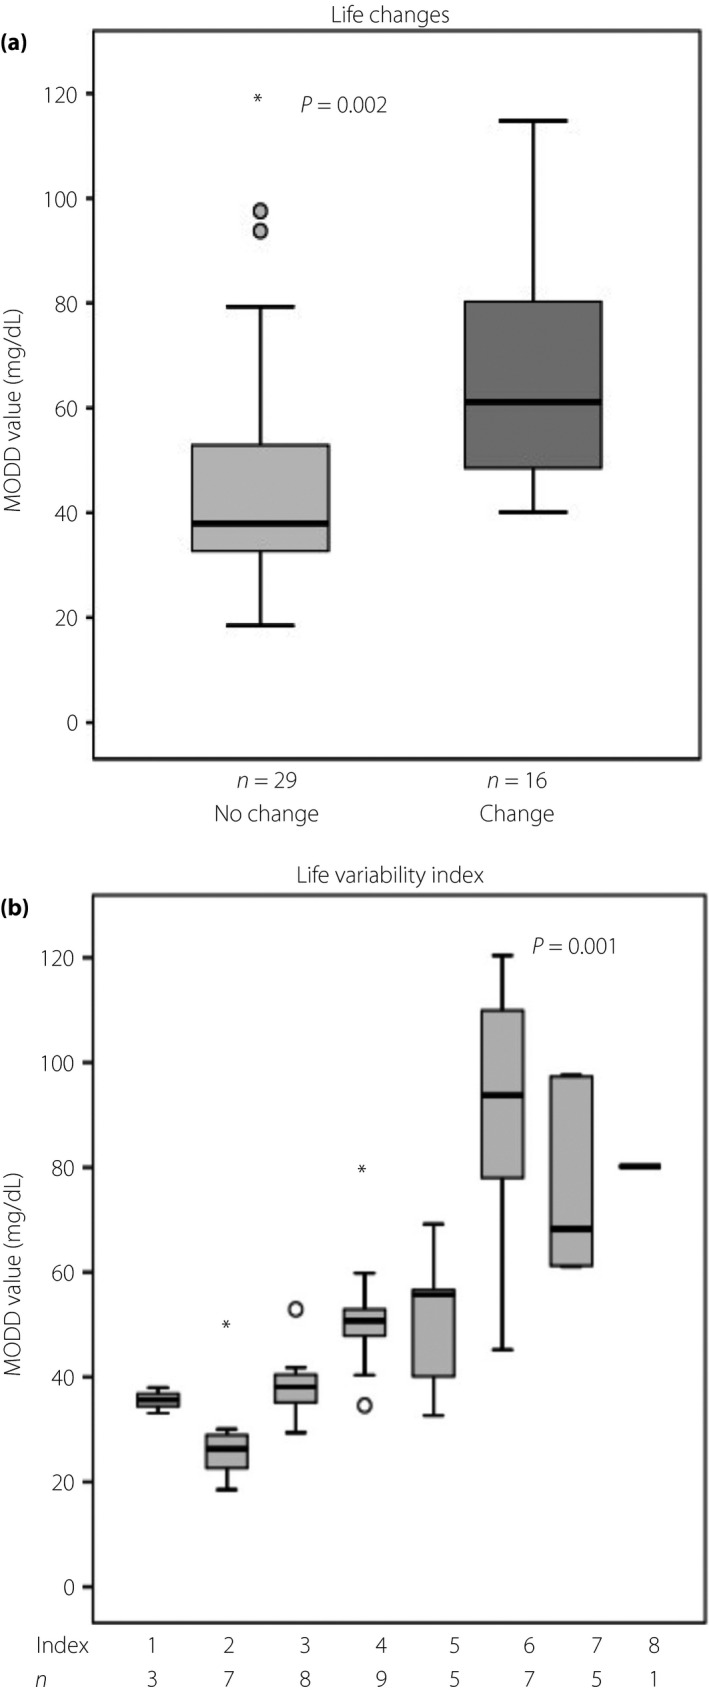
Figure 1.

Relationship between mean of daily differences (MODD) in blood glucose levels and life variability. (a) Difference in mean MODD value between patients with lifestyle changes and those without. Between‐group comparisons were tested by unpaired Mann–Whitney U‐test. (b) Mean MODD value according to life variability index. One‐way anova and Games–Howell test were used to compare the groups. In these box‐and‐whisker plots, lines within the boxes represent median values; the upper and lower lines of the boxes represent the 25th and 75th percentiles, respectively; and the upper and lower bars outside the boxes represent the 90th and 10th percentiles, respectively. Asterisk is the extreme values among the outliers. *This represents a case with a value of more than three times the height of the box.
