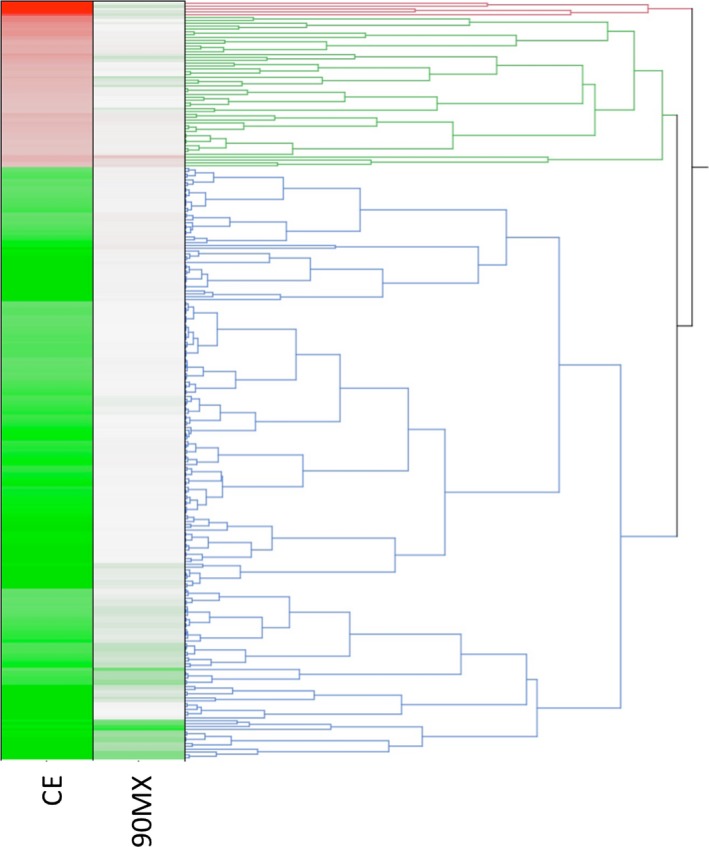
Figure 2.

Comprehensive analysis of gene expression. Analysis of gene expression by high‐density microarrays was performed by microarrays as described in Material and Methods. Average expression values (n = 3 arrays per group) were exported to JMP (SAS Institute, Cary NC) and hierarchical clustering performed. Data were expressed relative to the DMSO‐treated group with green representing a decrease and red an increase relative to control (depicted as white).
