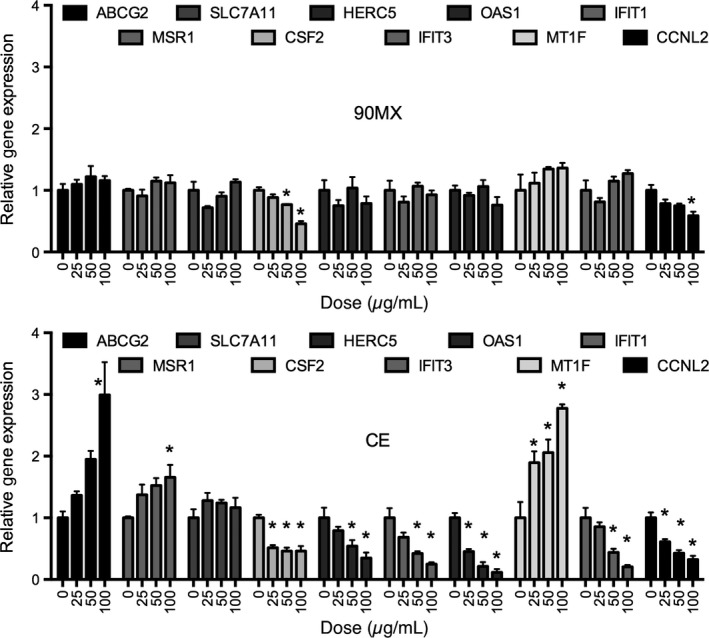
Figure 3.

Expression of selected genes identified as responsive to cranberry extracts in THP‐1 cells. Genes were selected from Table 2 to Figure 2 for validation by real‐time PCR. Cells were treated and RNA extracted as described in Material and Methods. Gene expression following treatment with 90MX or CE (0, 25, 50, 100 μg/mL) is expressed relative to a housekeeping gene (18S) and normalized to vehicle control (DMSO). Asterisks denote significantly different than control (P < 0.05, n = 3, bars represent mean and SEM).
