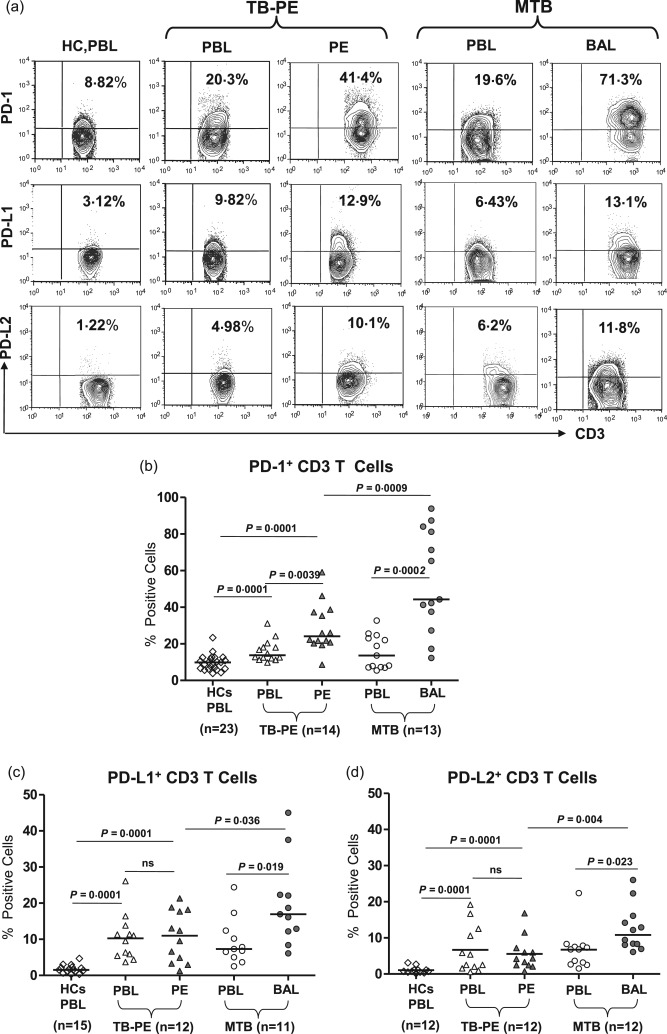
Figure 1.

Profound increase in the frequency of programmed death‐1 (PD‐1) and its ligands (PD‐L1 and PD‐L2) expressing T cells from miliary tuberculosis (MTB): PD‐1 and its ligand expression was examined on total CD3+ T cells derived from healthy controls (HC) and various forms of tuberculosis (TB) patients [TB‐pleural effusion (PE) and MTB]. (a,b) Representative fluorescence activated cell sorter (FACS) plots show expression of PD‐1, PD‐L1 and PD‐L2 on gated CD3+ T cells of HC and in paired samples of TB‐PE [peripheral blood (PB) versus PE] and MTB [PB versus bronchoalveolar lavage (BAL)] patients. (b–d) Scatter diagram shows percentage of PD‐1‐, PD‐L1‐ and PD‐L2‐expressing CD3+ cells in paired samples of TB‐PE (PB versus PE) and MTB (PB versus BAL) patients. Analysis shows a significant increase in the frequency of PD‐1‐, PD‐L1‐ and PD‐L2‐positive T cells among patients compared to that of HC. Interestingly, the percentage of PD‐1 and its ligands expressing T cells from BAL of MTB were significantly higher than the PE of TB‐PE patients and the autologous mononuclear cells (MNC) of MTB. Each symbol represents a single individual. Horizontal line depicts the median value. Statistical analysis was based on the non‐parametric Mann–Whitney unpaired t‐test.
