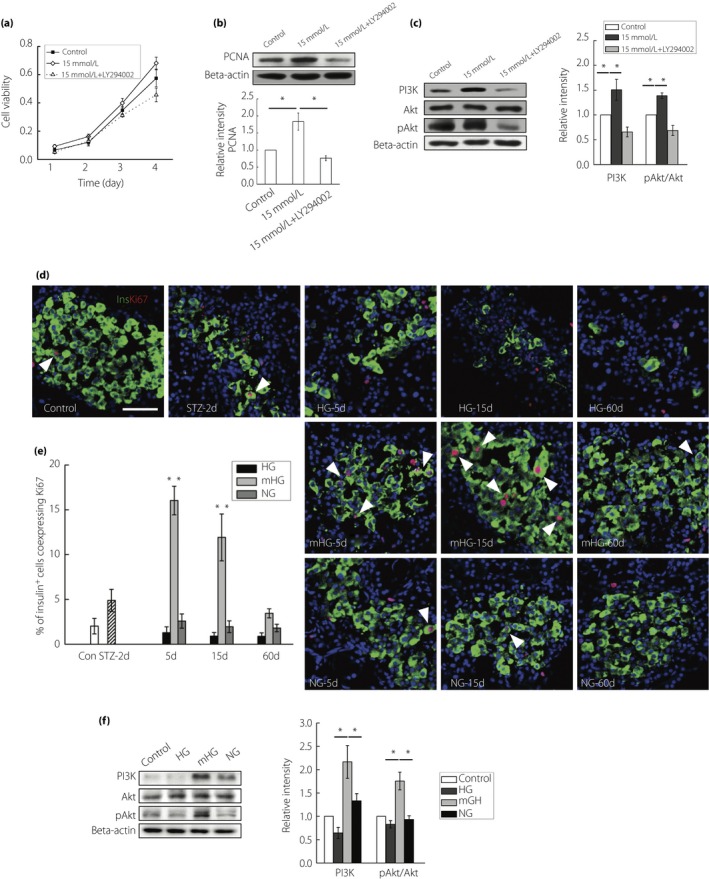
Figure 3.

Mild hyperglycemia enhanced β‐cell replication. (a) INS1 cells were treated with 11.1 mmol/L glucose, 15 mmol/L glucose or a combination of 15 mmol/L glucose and a PI3K inhibitor (Ly294002, 10 mol/L). Cell viability of these cells was detected at indicated time‐points. Values are mean ± standard deviation of three individual experiments. (b) Western blot detection of proliferating cell nuclear antigen (PCNA) in INS1 cells exposed to 11.1 mmol/L glucose, 15 mmol/L glucose or a combination of 15 mmol/L glucose and 10 mol/L Ly294002, with densitometry analysis. (c) Western blot detection of PI3K, Akt and pAkt in INS1 cells exposed to 11.1 mmol/L glucose, 15 mmol/L glucose or a combination of 15 mmol/l glucose and 10 mol/L Ly294002, with densitometry analysis. (d) Representative islets stained with antibodies against insulin (green) and Ki67 (red) of normal rats (Control; n = 5), streptozotocin (STZ)‐treated rats at day 2 (STZ‐2d; n = 5), and rats at day 5, day 15 and day 60 with no treatment (HG‐5d, HG‐15d, HG‐60d; n = 4), mild hyperglycemia incubation (mHG‐5d, mHG‐15d, mHG‐60d; n = 4) and euglycemia incubation (NG‐5d, NG‐15d, NG‐60d; n = 4). The arrows: insulin+ cells showing Ki67 expression. Nuclei were labeled with 40′,6‐diamidino‐2‐phenylindole. Scale bars, 50 μm. (e) Quantification of insulin+ cells co‐expressing Ki67 was shown. The results are presented as the mean ± standard deviation. (f) Western blot detection of PI3K, Akt and pAkt in isolated islets of normal rats, and rats at day 15 with no treatment (HG; n = 3), hyperglycemia incubation (mHG; n = 3) and euglycemia incubation (NG; n = 3), with densitometry analysis. The results of western blot are presented as the mean ± standard deviation from three independent experiments. *P < 0.05, **P < 0.01.
