
Figure 2.
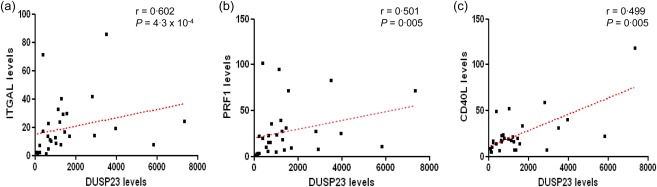
Correlations between transcripts levels of dual‐specificity protein phosphatase 23 (DUSP23) and integrin subunit alpha L (ITGAL) (a), DUSP23 and perforin 1 (PRF1) (b), and DUSP23 and CD40L (c) in CD4+ T cells of patients affected with SLE. Correlations are indicated by the Spearman's rank correlation coefficient (r) and the P‐value. [Colour figure can be viewed at wileyonlinelibrary.com]