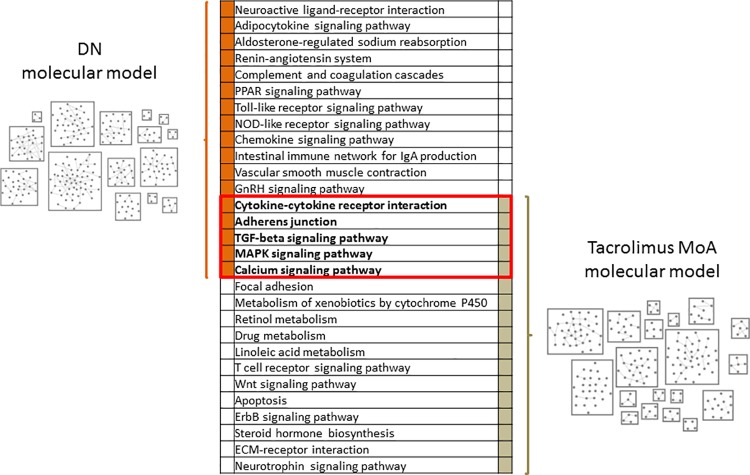
Fig 1. Molecular models.
Schematic representation of the constructed DN molecular model and the tacrolimus MoA molecular model with the list of significantly enriched molecular pathways based on the two molecular model features sets. Molecular pathways in bold font within the red border were significantly enriched in molecular features of both molecular model sets. Each box in the molecular model representations depicts one process unit, characterized by highly inter-connected proteins, with individual nodes representing protein coding genes.

