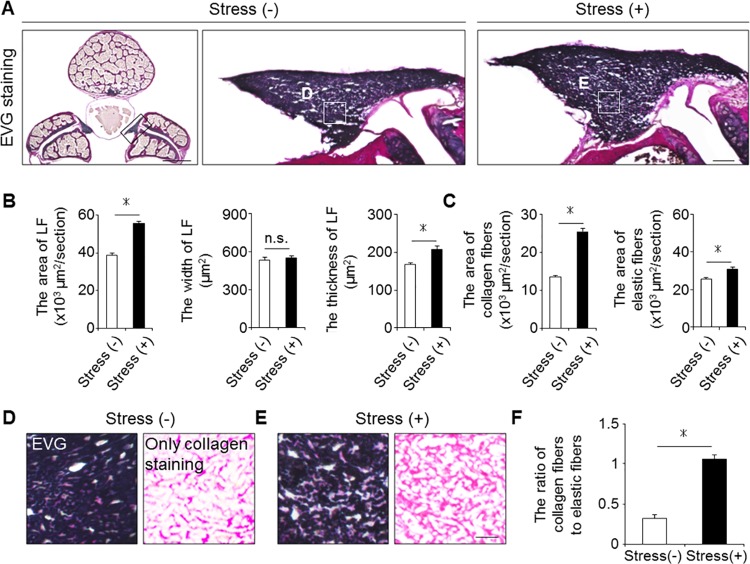
Fig 2. Mechanical stress induced LF hypertrophy.
(A) Axial sections of the mouse LF with/without 12-week mechanical stress loading on EVG staining. (B and C) Bar graphs showing the cross-sectional area, width, thickness, and the area of collagen fibers and elastic fibers in the two groups. (D and E) High magnifications of (A). (F) Bar graph showing the ratio of collagen fibers to elastic fibers in the two groups. Scale bars (A): 500 μm; insets: 50 μm; (D and E): 10 μm. *p < 0.05, Wilcoxon’s rank sum test, n.s. = not significant (n = 5/group).

