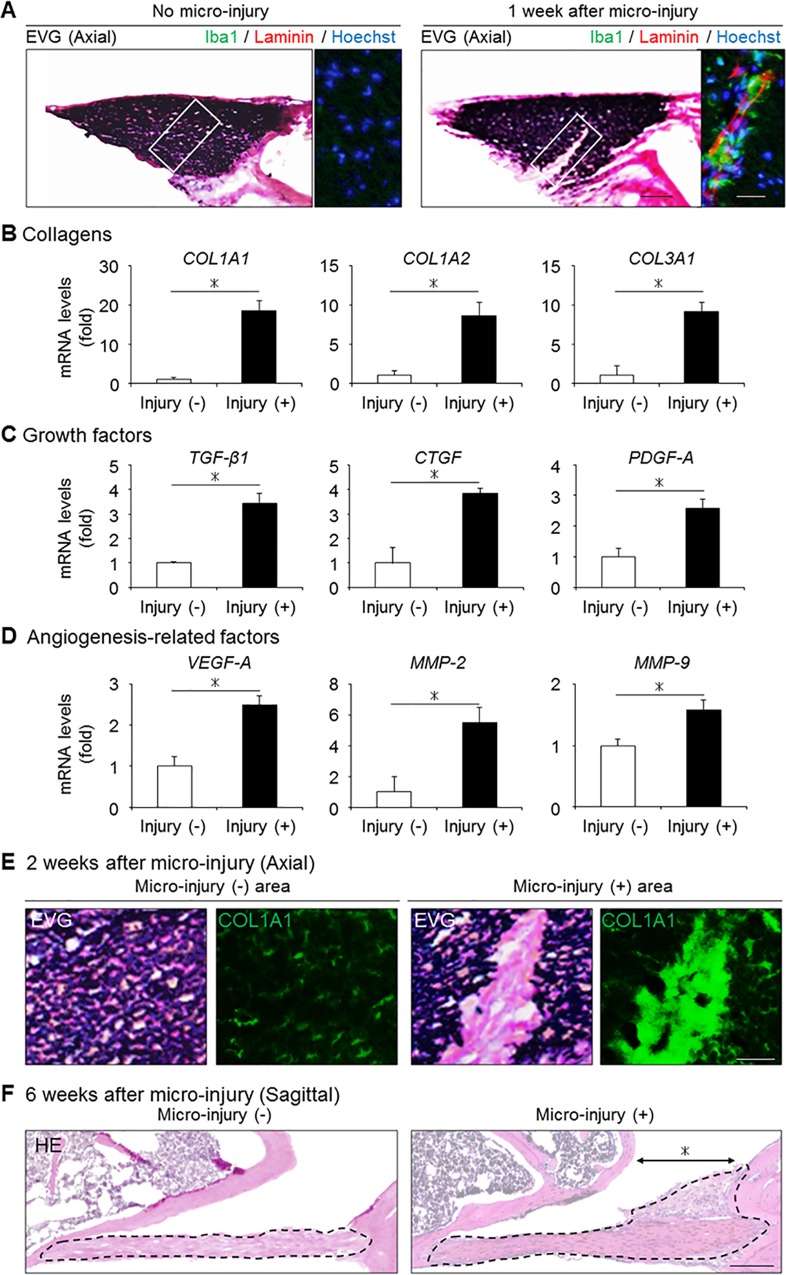
Fig 6. The influence of macrophage infiltration following micro-injury on the mouse LF.
(A) The presence of infiltrating macrophages (Iba1, green) and neovascular vessels (laminin, red) in the mouse LF with/without micro-injury. (B-D) Bar graphs showing the gene expression of collagens, fibrosis-related growth factors, and angiogenesis-related factors in the two groups. (E) The collagen synthesis in the injured area (COL1A1, green) at 2 weeks after micro-injury. (F) Sagittal sections of the mouse LF with/without micro-injury on HE staining at 6 weeks after micro-injury. The black broken lines indicate the outlines of the LF. The asterisk indicates the area to which micro-injury was applied. *p < 0.05, Wilcoxon’s rank sum test (n = 5/group). Scale bars (A): 50 μm; insets: 20 μm; (E): 20 μm; (F) 200 μm. COL1A1, collagen type 1 alpha 1; TGF-β1, transforming growth factor-β1; CTGF, connective tissue growth factor; PDGF-A, platelet-derived growth factor-A; VEGF-A, vascular endothelial cell growth factor-A; MMP, matrix metalloproteinase.

