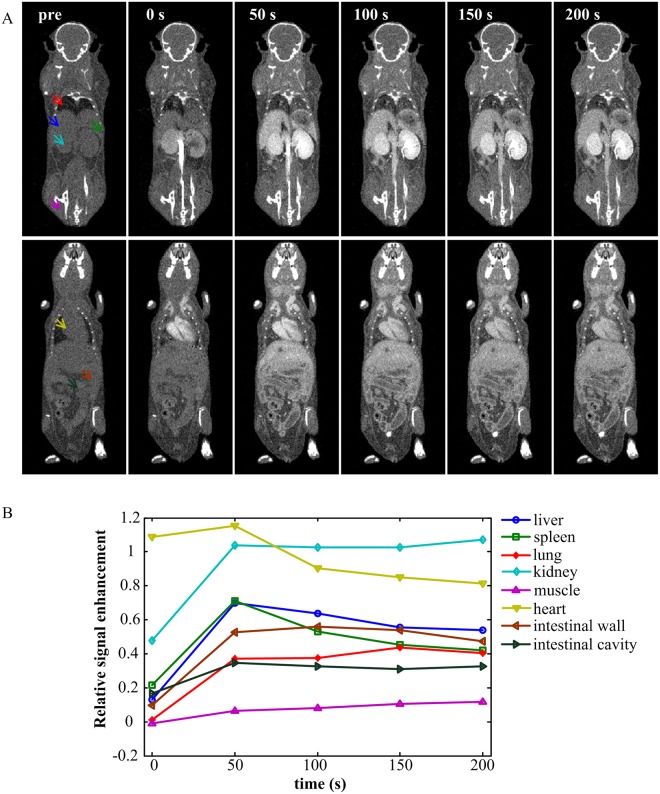
Fig 2. Dynamic contrast enhancement procedure after contrast agent administration.
(A) Representative coronal micro-CT images before contrast agent injection and at 0 s, 50 s, 100 s, 150 s, and 200 s post-contrast injection. The image at 0 s was acquired during the inflow of contrast agent. All of the images are displayed with the same gray scale window. (B) The relative signal enhancement versus time curves of regions depicted by the arrows in (A) with the same colors.

