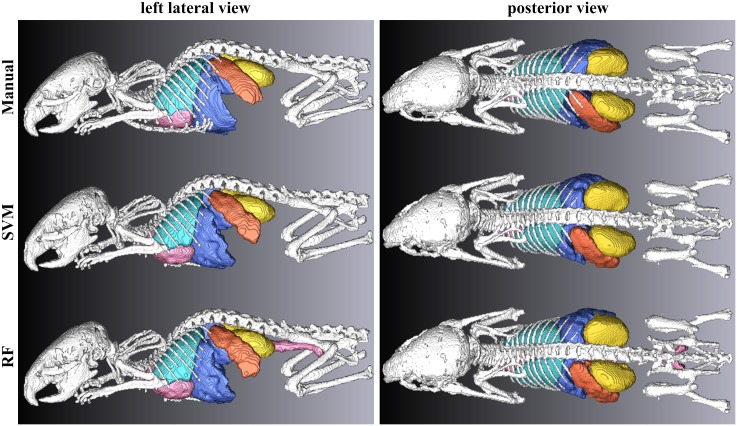
Fig 5. Visual comparison of the segmentation results with the reference datasets, shown in 3-D isosurface rendering.
Left column: left lateral view. Right column: posterior view. Top row: manual segmentation (M1). Middle row: segmentation obtained by the SVM. Bottom row: segmentation obtained by the RF.

