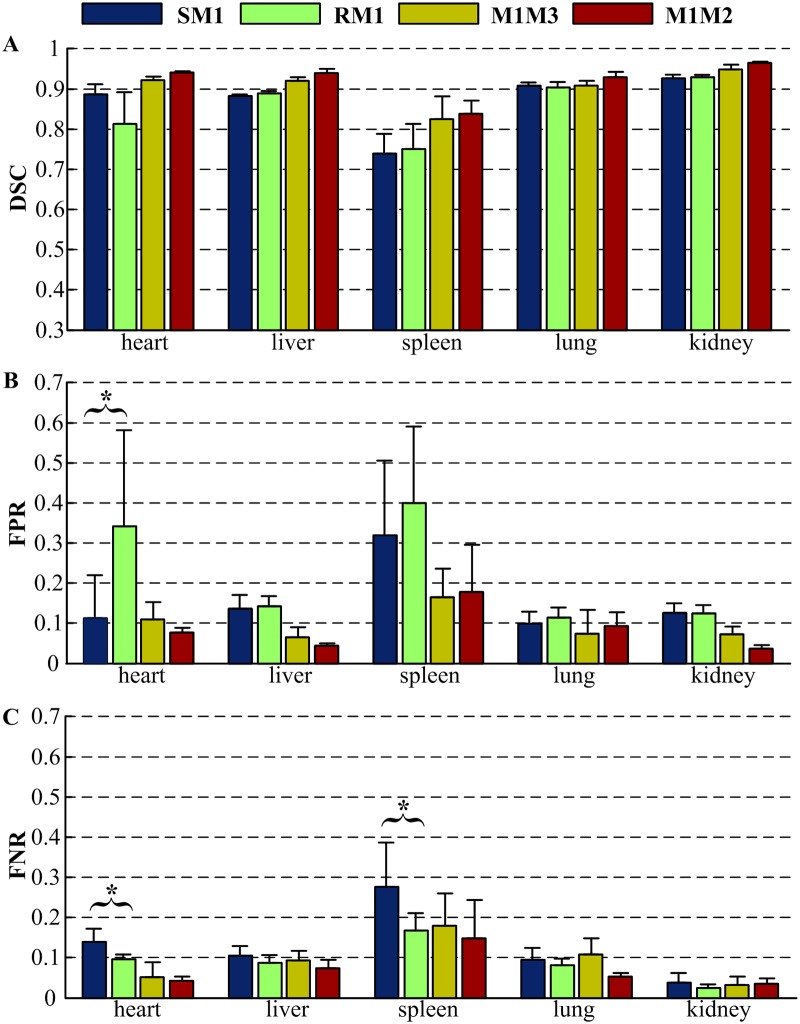
Fig 7. Quantitative evaluation of the proposed methods by comparison to manual segmentation.
‘SM1’ and ‘RM1’ represents the comparison of the automatic segmentation by SVM and RF with the manual segmentation (M1), respectively. ‘M1M3’ compares the manual segmentations of two independent experts. ‘M1M2’ compares two manual segmentation repetitions of one expert. (A) Dice similarity coefficient. (B) False positive ratio. (C) False negative ratio. (* Indicates p < 0.05.)

