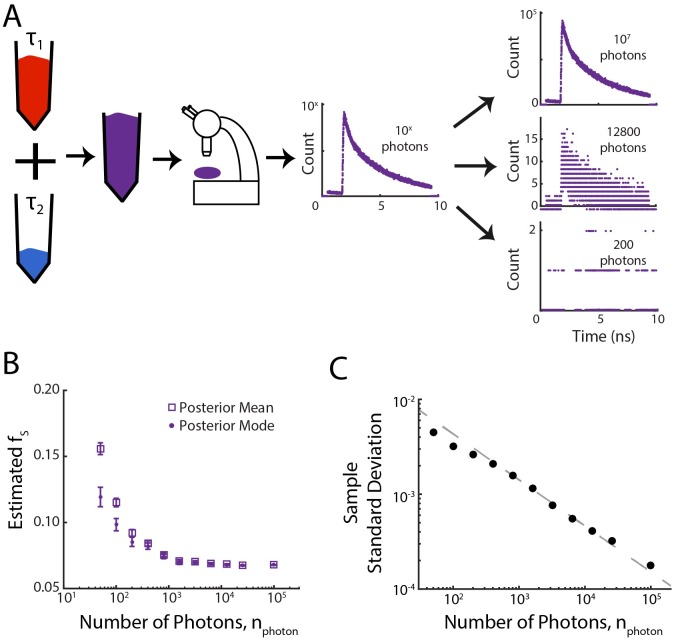
Fig 2. Low-Photon Regime.
(A) Control dyes having known long (Coumarin 153) and short (Erythrosin B) lifetimes were mixed at a fixed ratio. From the measured master curve of photon arrival times, a variable number of photons are randomly sampled, generating histograms with a variable number of photons. (B) Bias in the estimated short-life photon fraction, fS, decreases with increasing photon number. Data points represent the average of the posterior mean (squares) or mode (circles) for 300 independent samplings for each photon count. Error bars are s.e.m. (C) Black circles: measured sample standard deviations from data in Fig 2B averaged across the 300 independent samplings. The sample standard deviation decreases approximately as . Power law fit to a × xb for all but the four lowest values of nphoton shown in gray, with a = 0.04 ± 0.01 and b = −0.48 ± 0.04 (95% confidence interval).

