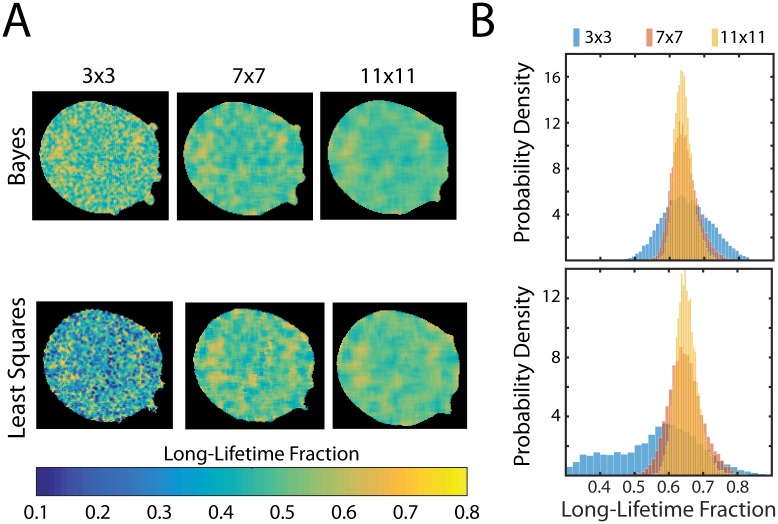
Fig 4. In vivo Testing.
(A) FLIM images depicting the long-lifetime fraction from measurements of mTurquoise2 in a U2OS cell. Photons were pooled from pixels grouped using boxcar windowing into groups of either 3 × 3, 7 × 7, or 11 × 11 pixels and analyzed using either the Bayesian analysis presented here, or least-squares fitting. (B) Histograms showing the probability density of the long-lifetime fraction from images in (A). The probability density functions from Bayesian analysis were found to have mean values of 0.648 ± 0.069, 0.642 ± 0.037, and 0.640 ± 0.026 (mean ± s.d.) for 3 × 3, 7 × 7, and 11 × 11 binning respectively, while the means values were found to be 0.558 ± 0.137, 0.648 ± 0.050, and 0.652 ± 0.034 (mean ± s.d.) for 3 × 3, 7 × 7, and 11 × 11 binning respectively using least-squares-fitting.

